Figure 1.
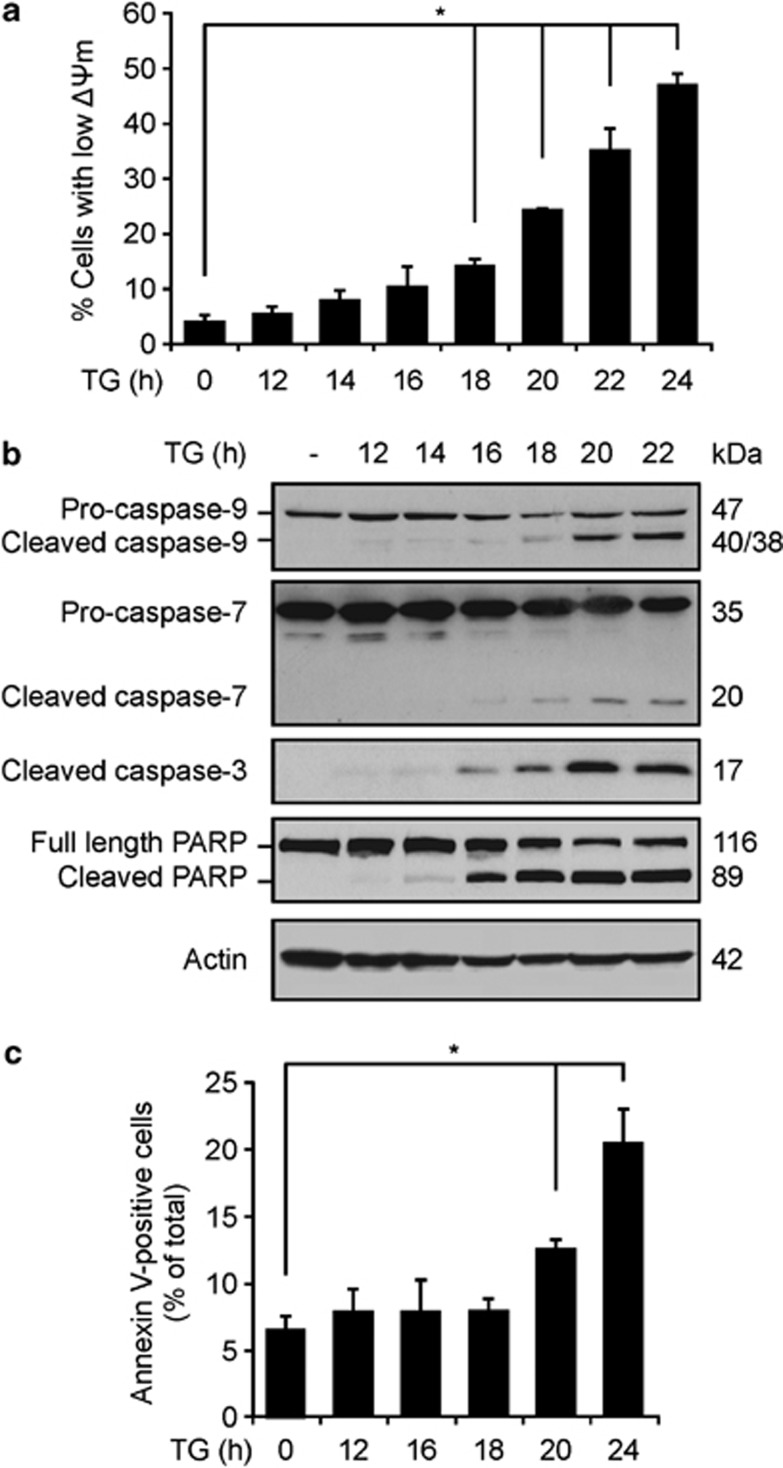
Kinetics of apoptosis-related changes in TG-treated PC12 cells. PC12 were treated with 1 μM TG for the indicated times. (a) Loss of mitochondrial transmembrane potential (ΔΨm) was analysed using TMRE stain. Cells were harvested by trypsinisation and treated with 100 nM TMRE for 30 min in the dark. Fluorescence of the cells was measured at 582 nm by flow cytometry. Cells with low TMRE fluorescence were expressed as a percentage of the total cells. The results shown correspond to the mean±SEM of three separate experiments. *P<0.01 using Bonferroni post hoc test. (b) TG-induced activation of caspases was analysed by western blotting using antibodies to caspase-9, -7, -3 and PARP. Actin was used as a loading control. (c) Externalisation of PS was analysed using Annexin V-FITC labelling. Cells were harvested by trypsinisation, allowed to recover for 15 min and then resuspended in calcium buffer containing Annexin V-FITC. The fluorescence of the cells was measured at 495 nm by flow cytometry. *P<0.005 using LSD post hoc test

