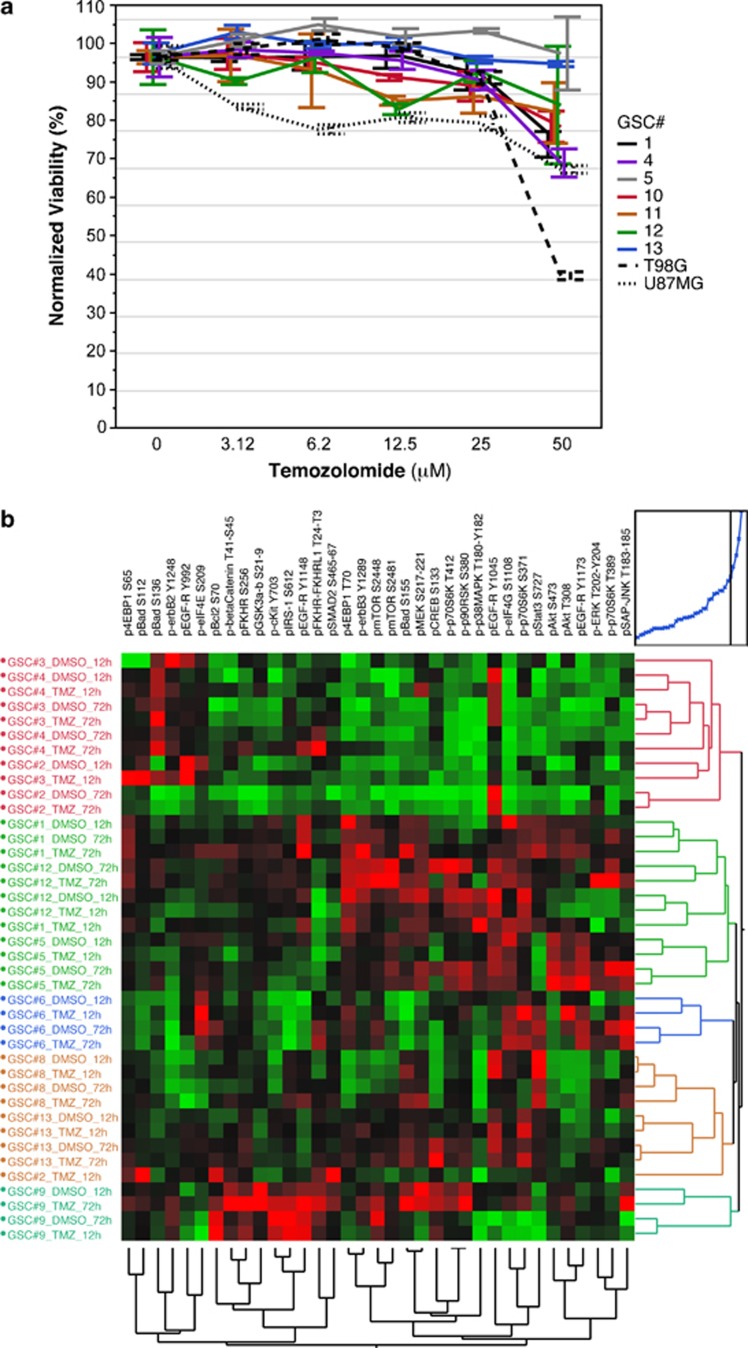
Figure 1.
TMZ treatment and RPPM analysis of GSCs. (a) A collection of GSCs and two commercially available GBM cell lines have been treated with increasing doses of TMZ and viability was measured at 72 h. Data are represented as mean±S.E.M. from at least three independent experiments. (b) Hierarchical clustering of RPPM data (mean of three technical replicates) obtained by assaying a panel of antibodies mainly directed against components of the EGF-R and PI3-K/AKT/mTOR pathways on protein lysates of selected GSC lines treated either with vehicle (DMSO) or with 50 μM TMZ for either 12 or 72 h. Colored clusters were selected by cutting the dendrogram at the height indicated in the upper-right hierarchy plot. A summary of the phosphoproteins present in each cluster is available as Supplementary Table S2

