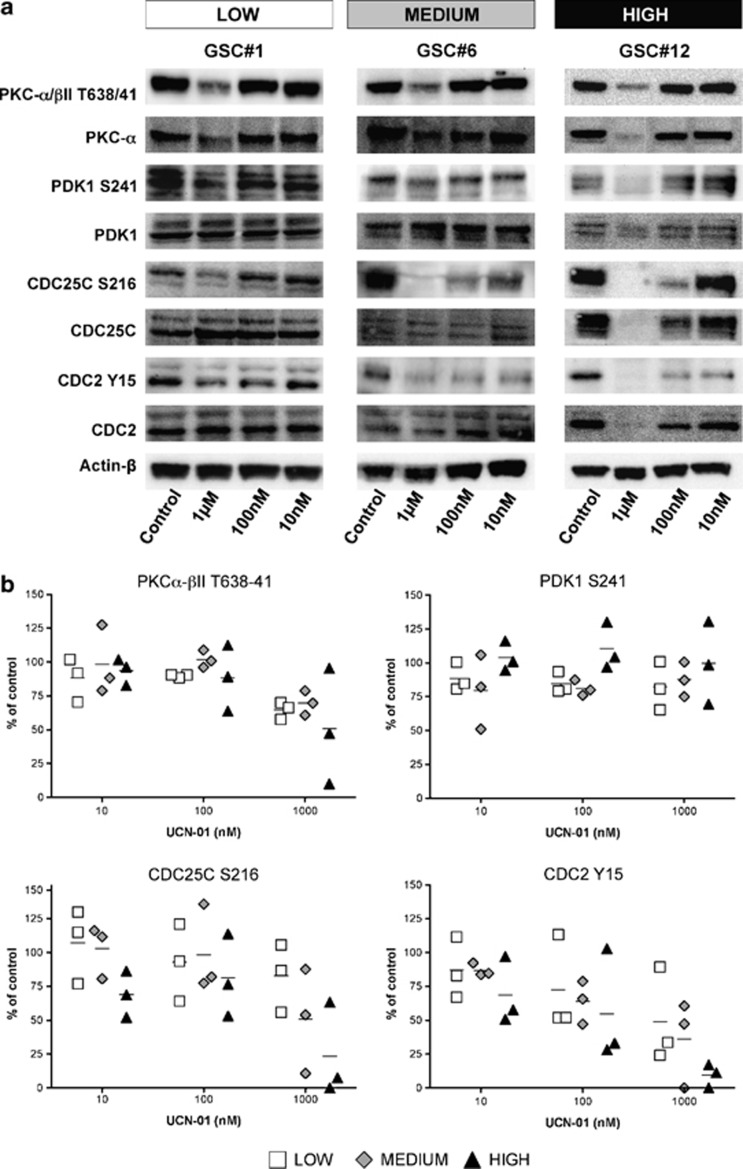
Figure 3.
Immunoblot analysis of UCN-01 targets. (a) GSC lines selected from each sensitivity group were exposed to increasing doses of UCN-01 and the phosphorylation levels of PKC, PDK1, CDC25C, and CDK1 (CDC2) were evaluated at 72 h. Representative blots are shown for three GSC lines (Supplementary Figure S4 displays the blots performed on the other tested GSC lines in each sensitivity group). (b) Normalized intensities of the immunoblot bands from each antibody tested are plotted for all three GSC lines in each sensitivity group as percentage over the untreated control. No statistically significant difference between sensitivity groups at various UCN-01 concentrations was found after two-way ANOVA and Bonferroni post test

