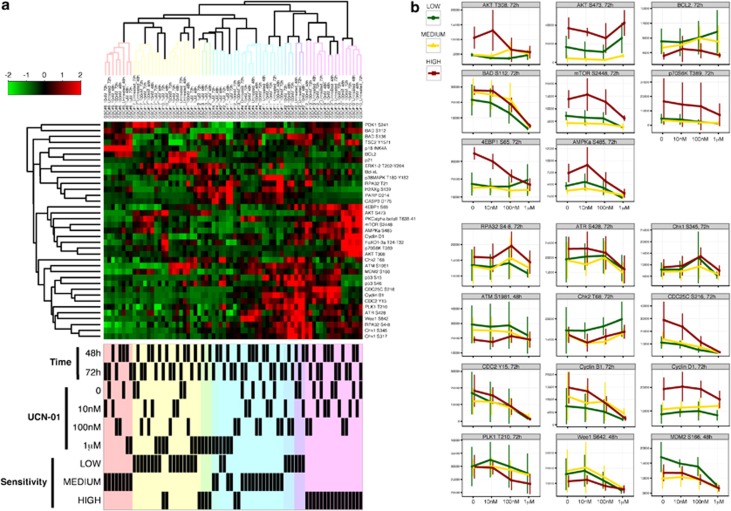
Figure 4.
RPPM analysis on GSCs treated with UCN-01. (a) Annotated hierarchical clustering heatmaps of RPPM data obtained on nine GSCs treated with DMSO (untreated or 0) or increasing concentrations of UCN-01. Most analytes detected are part of the DNA damage response, cell cycle, and PI3K/AKT/mTOR pathways. Data for each GSCs represent the mean of three technical replicates. (b) Normalized intensity plots of end points extracted from the RPPM data and involved in the PI3K/AKT/mTOR, DNA-damage response, and cell cycle pathways. Mean and SD (n=3) for each sensitivity group are connected by solid, colored lines at increasing concentrations of UCN-01. The name of the analyte and the time point are reported on top of every single plot

