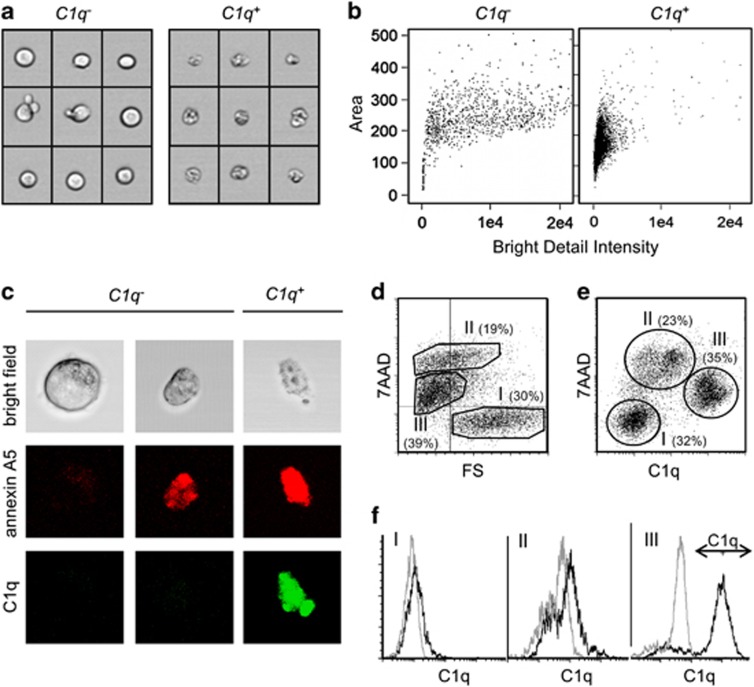
Figure 2.
Characterization of C1q-binding cells. Jurkat cells were cultured in UC medium in the presence of 20 μM oxaliplatin for 48 h. Then cells were incubated for an additional hour in UC medium supplemented with 25% NHS. After staining with annexin A5, 7AAD and C1q-specific antibodies cells were analyzed either by imaging flow cytometry (a and b), confocal microscopy (c) or conventional flow cytometry (d–f). (a) Bright field images of representative C1q− and C1q+ cells. (b) Graphs plotting the area of every image feature (as a measure of the cell volume) against the bright detail intensity (as a measure of the gray value contrast in the bright field image). (c) Confocal microscopy images of cells stained with annexin A5 and C1q-specific antibody. (d and e) Graphs plotting the 7AAD signal against the forward scatter (FS) or against the C1q signal. The indicated percentage values show the distribution of the cells between the three regions I, II and III. (f) Comparison of the binding of C1q-specific antibodies (black) with the binding of isotype control antibodies (gray) in the three region I, II and III, respectively (as separated according to the regions shown in e)

