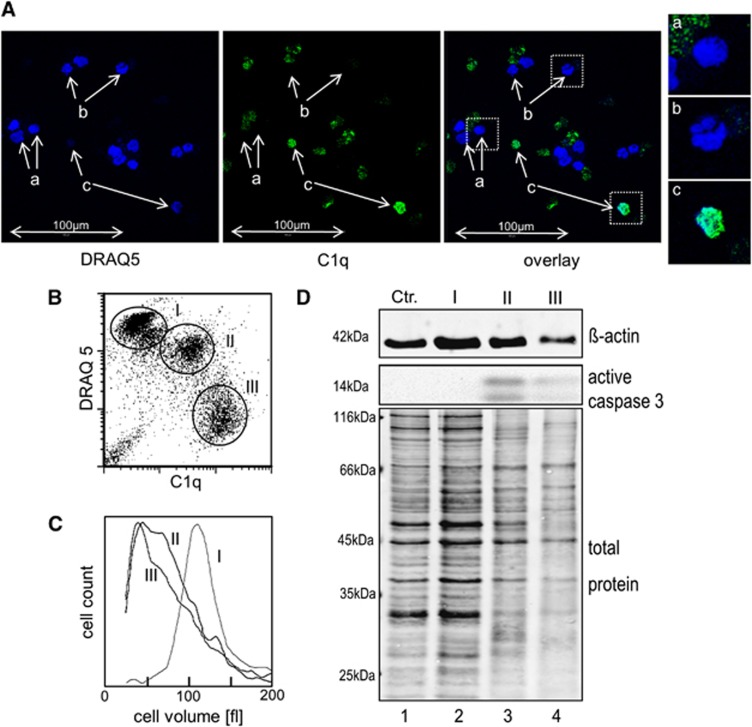
Figure 4.
Comparison of late apoptotic subpopulations. (A and B) DNA content of apoptotic cells. Jurkat cells were oxaliplatin treated for 48 h, incubated for an additional hour in 25% NHS and then stained with C1q-specific antibodies and with the membrane permeable DNA dye DRAQ5. (A) Confocal microscopy images show C1q-negative cells with round shaped (a) and fragmented (b) nuclei and C1q-positive cells with almost no DRAQ5 signal (c). (left image, DRAQ5; middle image, C1q; right image, overlay; the three rightmost images show selected cells from overlay). (B) The graph plots the C1q signal against the DRAQ5 signal as assessed by flow cytometry. (C and D) Cell shrinkage and protein degradation during apoptosis. Jurkat cells were oxaliplatin treated and incubated in NHS as described above. Then cells were stained with 7AAD cells and FACS sorted in populations I, II and III according to the FS/7AAD signal. (C) Cell volume distribution of the tree populations as determined in an automated cell counter. (D) Western blot analysis using anti-β-actin antibodies, anti-caspase-3 antibodies and ruthenium-(II)-tris (bathophenanthroline disulfonate) (RuBPS) (for visualization of the total protein)

