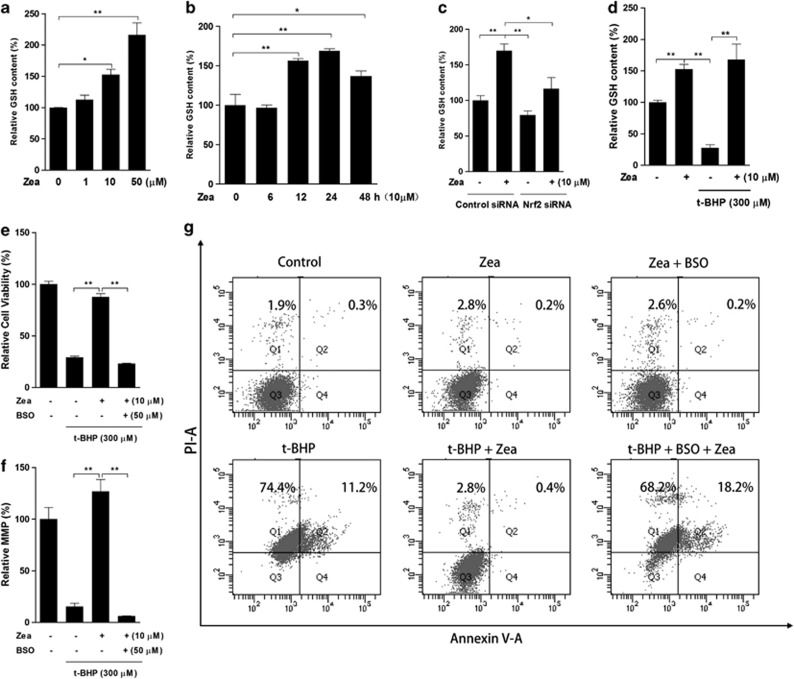
Figure 5.
GSH is the critical effector of the protective effects of Zea. Total GSH levels were measured following the Zea treatment of ARPE-19 cells: (a) dose response—cells were treated with 1, 10, or 50 μM Zea for 24 h; (b) time response—cells were treated with 10 μM Zea for 6, 12, 24 or 48 h; (c) Nrf2 knockdown response—cells were transfected with Nrf2 siRNA for 24 h, followed by treatment with 10 μM Zea for an additional 24 h; (d) t-BHP response—cells were treated with 10 μM Zea for 24 h, followed by challenge with 300 μM t-BHP for an additional 6 h. In the presence of 50 μM BSO, cells were treated with 10 μM Zea for 24 h and then challenged with 300 μM t-BHP for an additional 6 h, after which cell viability (e), the mitochondrial membrane potential (f), and apoptosis activation (g) were analyzed. All data are shown as mean±S.E.M. The symbol ‘*' indicates statistical significance, as determined by one-way ANOVA (*P<0.05, **P<0.01, n=3)

