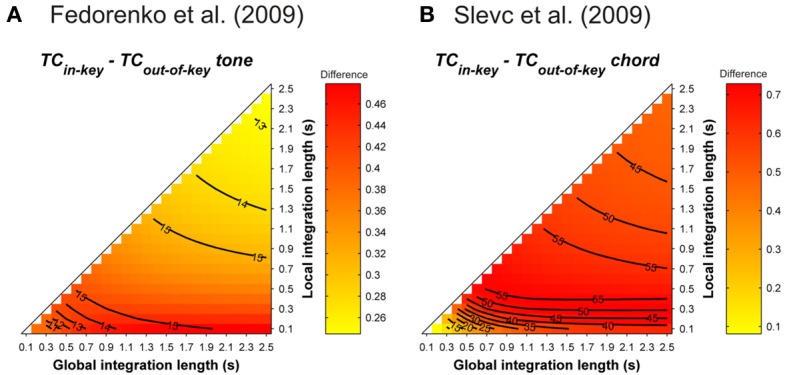
Figure 13.

Mean TC differences between tonic vs. out-of-key tones (A, Fedorenko et al., 2009) and tonic vs. out-of-key chords (B, Slevc et al., 2009), as a function of the local and global context integration windows. Positive, negative, and nonsignificant differences are represented by hot, cold, and white colors, respectively (two-tailed paired t-test, p < 0.05; t-values are reported as contours).
