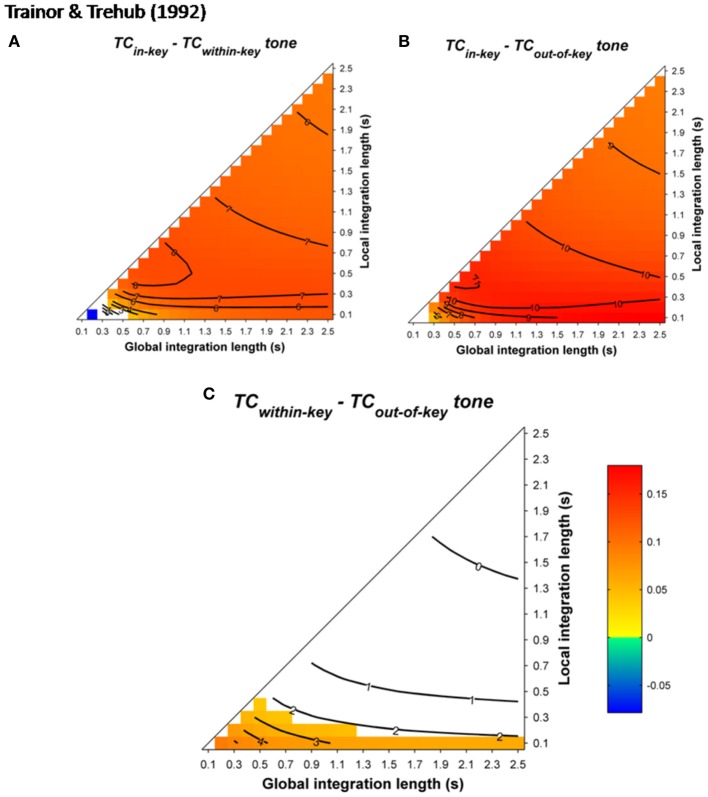
Figure 15.
Simulation of Trainor and Trehub's (1992) study. Panels (A,B) show the TC differences for in-key minus within-key and in-key minus out-of-key targets, respectively. Positive, negative, and nonsignificant differences are represented by hot, cold, and white colors, respectively (two-tailed paired t-test, p < 0.05; t-values are reported as contours). All differences are positive (red) for both targets, but out-of-key targets are less correlated with the context than within-key targets (the map in B is redder than in A). This is illustrated in panel (C) that shows the difference of TC between within-key minus out-of-key targets. When significant, these differences are positives, meaning that TCwithin-key > TCout-of-key. In other words, the out-of-key tone decorrelates more than the within-key tone. The white area indicates no significant difference between both targets.

