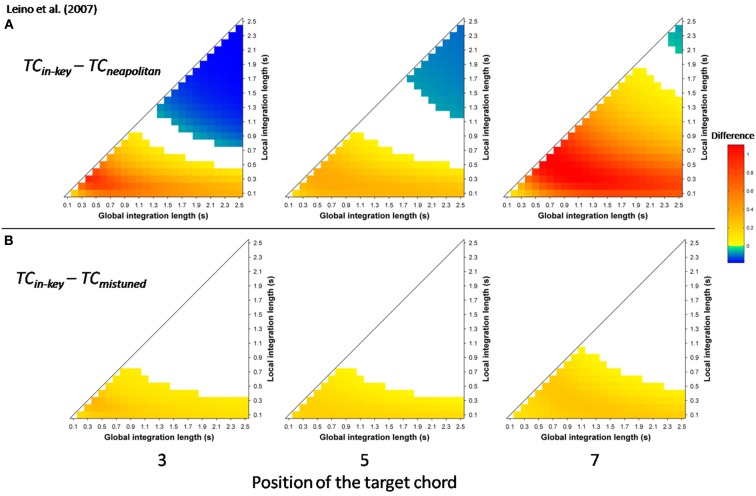
Figure 7.
Simulation data obtained with the stimuli of Leino et al. (2007). Mean TC differences (200 ± 25 ms after onset) as a function of the local and global context integration windows between in-key targets vs. Neapolitan chords (A), in-key targets vs. mistuned (but in-key) chords (B). Positive, negative, and nonsignificant differences are represented by hot, cold, and white colors, respectively (two-tailed paired t-test, p < 0.05; t-values are reported as contours). Each column represents a different position within the sequence.

