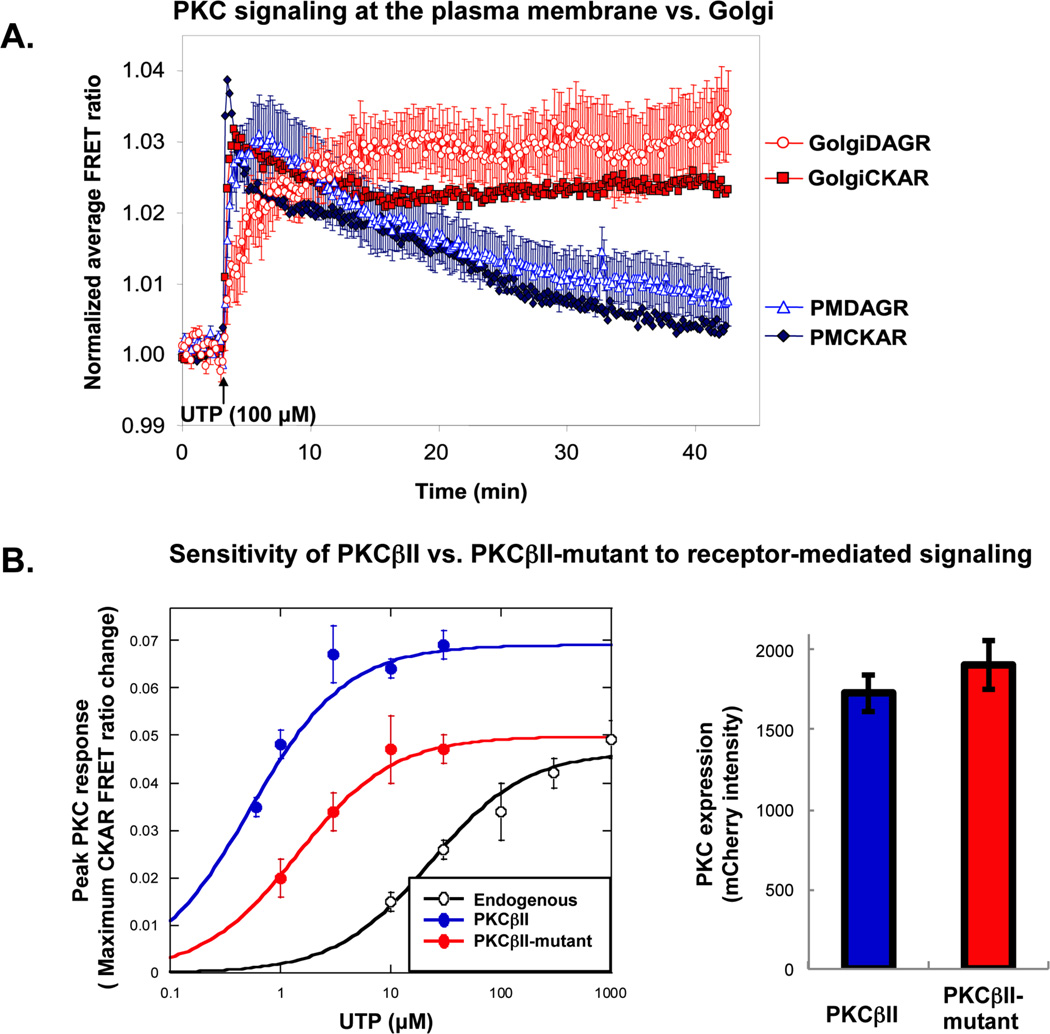
Figure 5. Examples of data generated using FRET-based reporters for PKC signaling.
A. Localized PKC signaling in response to UTP in COS7 cells. COS7 cells were transfected with PMCKAR (closed black diamonds), PMDAGR (open black triangles), Golgi-CKAR (gray squares) or Golgi-DAGR (open gray circles), and stimulated with UTP (100 µM); the average FRET ratio change was plotted over time. Here, targeted DAGR responses were not normalized for range, but cells expressing similar levels of CFP and YFP were imaged. Error bars represent SEM of data obtained from over 10 cells across three dishes per response. Note that, in this experiment, PKC activity and DAG production persist longer at the Golgi compared to the plasma membrane. Adapted from5. B. Using CKAR to test the effects of mutation on exogenous PKC. COS7 cells were transfected with CKAR alone (to monitor endogenous PKC activity, open circles), CKAR and mCherry-WT PKCII (closed black circles), or CKAR and m-Cherry PKCβII-mutant (closed gray circles). The left panel shows the maximal FRET ratio change in response to increasing concentrations of UTP. Each data point represents the maximum response determined by curve-fitting the average FRET ratio change within the first two minutes as described in section 3.5. Note that, in this case, the mutant PKC is desensitized to receptor-mediated signaling compared to the wild-type PKC. The right panel is a graph of mCherry intensity values, demonstrating equivalent expression of mCherry-tagged PKC constructs.

