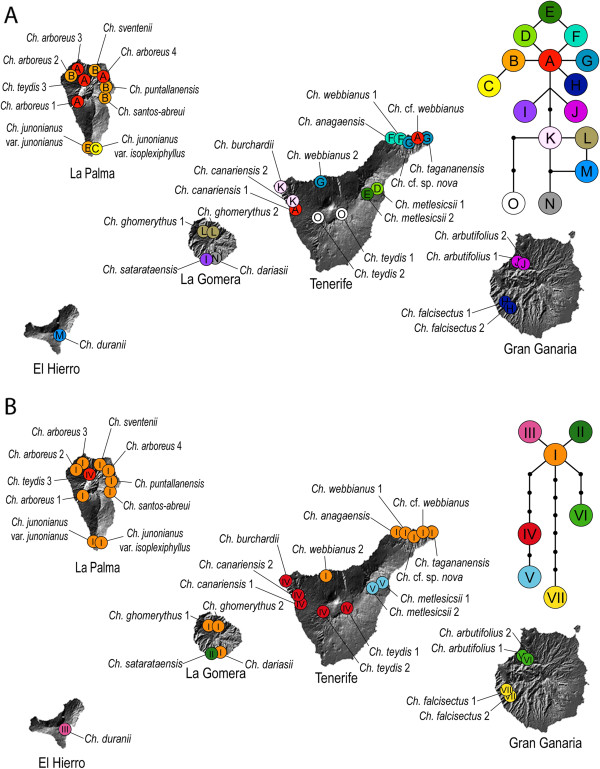
Figure 4.

Geographical distribution of populations and haplotypes of Canarian Cheirolophus sampled in this study. The upper figure (A) shows plastid DNA haplotypes while the lower one (B) shows nuclear DNA haplotypes. The insets represent the haplotype networks estimated by TCS.
