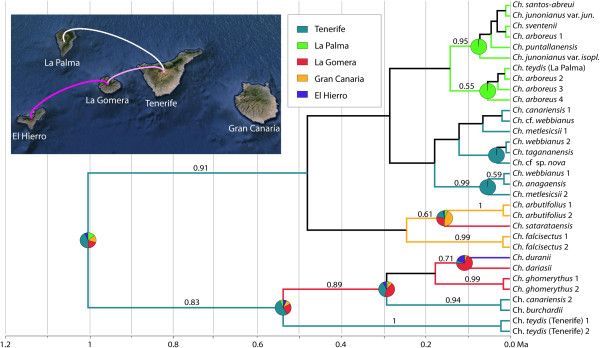
Figure 5.

Bayesian ancestral range reconstruction and colonization history of Canarian Cheirolophus based on plastid DNA markers. Numbers above branches are Bayesian posterior probabilities (PP). The colored branch lengths represent the ancestral range with highest marginal probability for each lineage as inferred in BEAST (only branches with PP > 0.5). Node pie charts represent marginal probabilities for alternative ancestral ranges. Colonization routes identified by BSSVS are shown on the map with lines (see text for more details).
