
Figure 1.
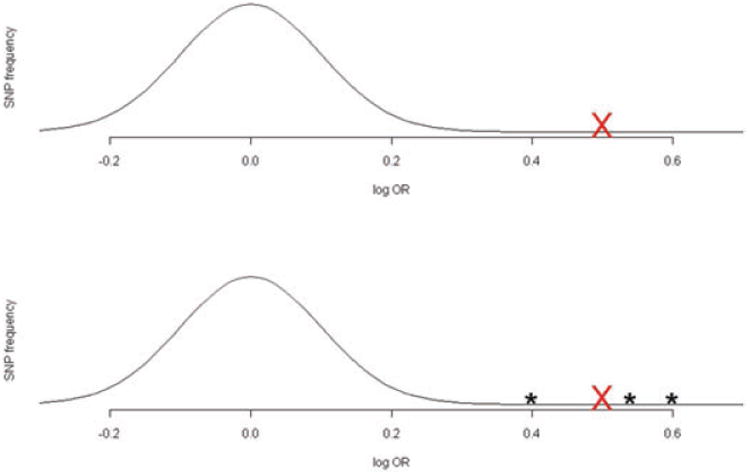
In the upper panel, the normal curve represents a hypothetical distribution of the true log-ORs of disease association for all SNPs on a genome-wide association platform. The lower panel represents an alternative scenario where there are 3 “outlier” SNPs with extremely large population level log-ORs, with the other log-ORs again following a normal distribution. In both scenarios, the largest estimated log-OR is represented by the red cross. It is intuitively clear that it is more appropriate to shrink the estimated OR in the first scenario compared to the second.