
Figure 2.
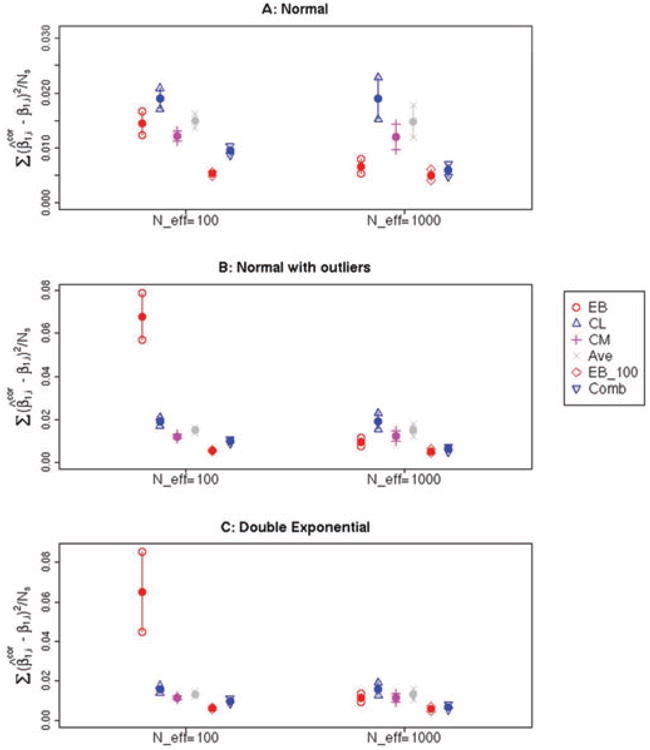
(A–C) Estimated mean and associated 95% confidence interval for the quantity , Where is the corrected estimate for the log-OR for a particular SNP and β1,i is the true underlying OR for the same SNP. The average was taken over genome-wide significant SNPs (having P < 0.05/105) in 100 simulations of a given scenario—note that the number of selected SNPs for a given simulation, #{i: pi < 0.05/105}, is denoted as Ns in the y-axis label. Six methods were used to correct the log-ORs: Empircal Bayes (EB), Conditional Likelihood (CL), Conditional Mean (CM), the Average of CL and CM (Ave), the Empirical Bayes estimator using all 100 simulations to estimate the marginal distribution (EB_100), and the Combination estimator (Comb). The distribution of the true log-ORs were simulated according to a Contaminated Normal distribution (A), Double Exponential (B) or Normal Distribution (C). The number of nonzero log-ORs was either 100 or 1,000.