
Figure 2. Exposure to G418 in F1 induces widespread changes in the composition of maternal RNA in the early F2 embryos.
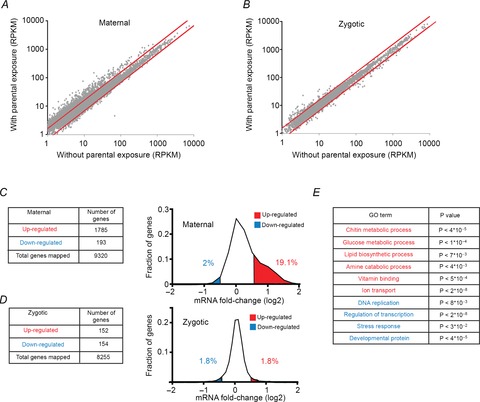
A, scatter plot of RPKM values of maternal RNA (0–2 h AEL) in F2 embryos of exposed versus non-exposed F1 flies. Each dot represents the corresponding transcription level for a particular gene in each case. Red lines indicate a difference of 1.5-fold between RPKM values. RPKM, reads per kilobase of exon model per million mapped reads. B, same as A for RPKM values measured in the zygotic stage (8–10 h AEL). C, number of genes changed (left) and distributions of differences (right) in levels of maternal RNA (0–2 h AEL) in F2 embryos of exposed versus non-exposed flies. Fractions of genes that were up- and down-regulated over 1.5-fold are labelled red and blue, respectively. Values are based on average measurements in two biological replicates. D, same as C for changes observed in the zygotic stage (8–10 h AEL). E, examples of enrichments of specific Gene Ontology (GO) annotations in the groups of genes that were up- (red) and down- (blue) regulated in the maternal stage. P-values, corrected for multiple testing using the DAVID web tool with Benjamini correction (Huang da et al. 2009b; Huang da et al. 2009a).