
Figure 4. Changes in maternal RNA in F2 embryos of G418-exposed flies tend to persist in the following generation (F3).
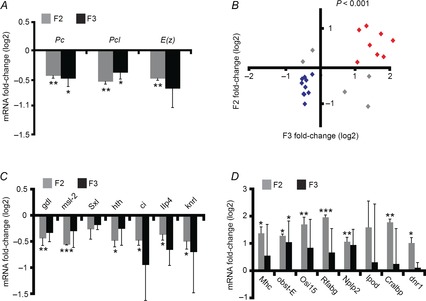
A, qPCR-based measurements of RNA of the PcG genes Pc, Pcl and E(z) in 0–2 h embryos of the F2 and F3 generations. Shown are relative levels in decedents of G418-exposed versus non-exposed F1 flies. Values are mean fold-change ± SEM based on three biological replicates. B, correlation between measurements in the F2 and F3 generations. Shown are fold-change qPCR-based measurements of maternal RNA corresponding to 23 genes. Fold-change refers to the difference between decedents of G418-exposed and non-exposed F1 flies. Genes that were up- and down-regulated in both generations are highlighted in red and blue, respectively. Significance of the positive correlation (P < 10−3) was determined by a random permutation test (see Methods). C, fold-change of maternal RNA levels for the blue highlighted genes in B. Values are mean fold-change ± SEM based on three biological replicates. D, as in C for red highlighted genes. *P < 0.05, **P < 0.01, ***P < 0.001 (Student's t test).