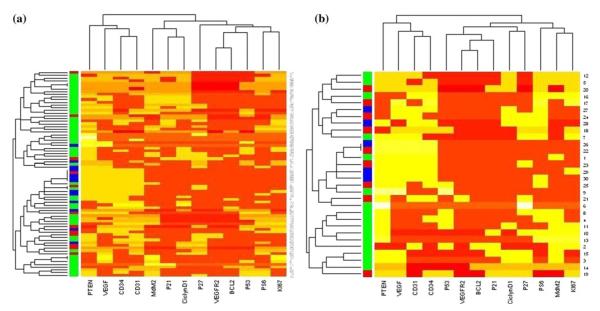
FIG. 1.
Expression profile of all patients (a) and patients with T1/T2 GBCA (b). Each row represents 1 patient; columns indicate the immunostaining results (positive = yellow; negative = red). Center of origin is indicated in the shaded column (red FALP, blue YCU, green MSKCC). The column dendrogram indicates patterns of protein clustering, and the row dendrogram indicates clustering by center

