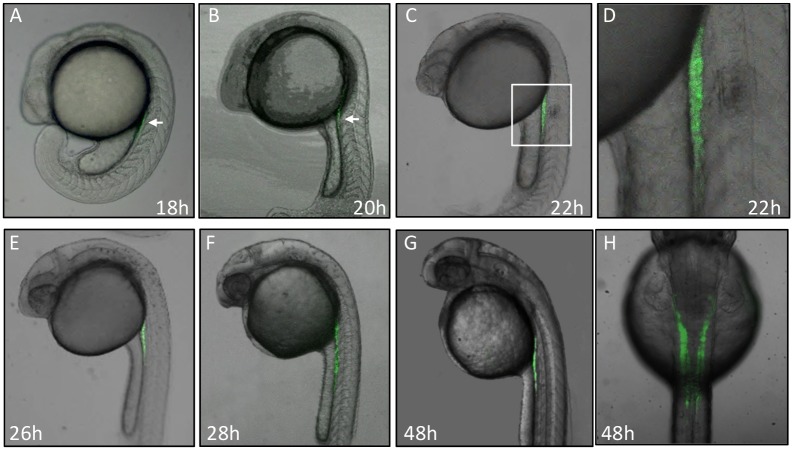
Figure 2. Dynamic GFP expression pattern during embryogenesis in Tg(gtshβ::GFP) line.
(A, B, C, E, F and G) show the lateral view of Tg(gtshβ:GFP) embryos at the indicated stages. A dorsal view of 48 hpf embryo is shown in H. The arrows show the expressed GFP in A and B. The boxed area in C was shown with a higher magnification in D.

