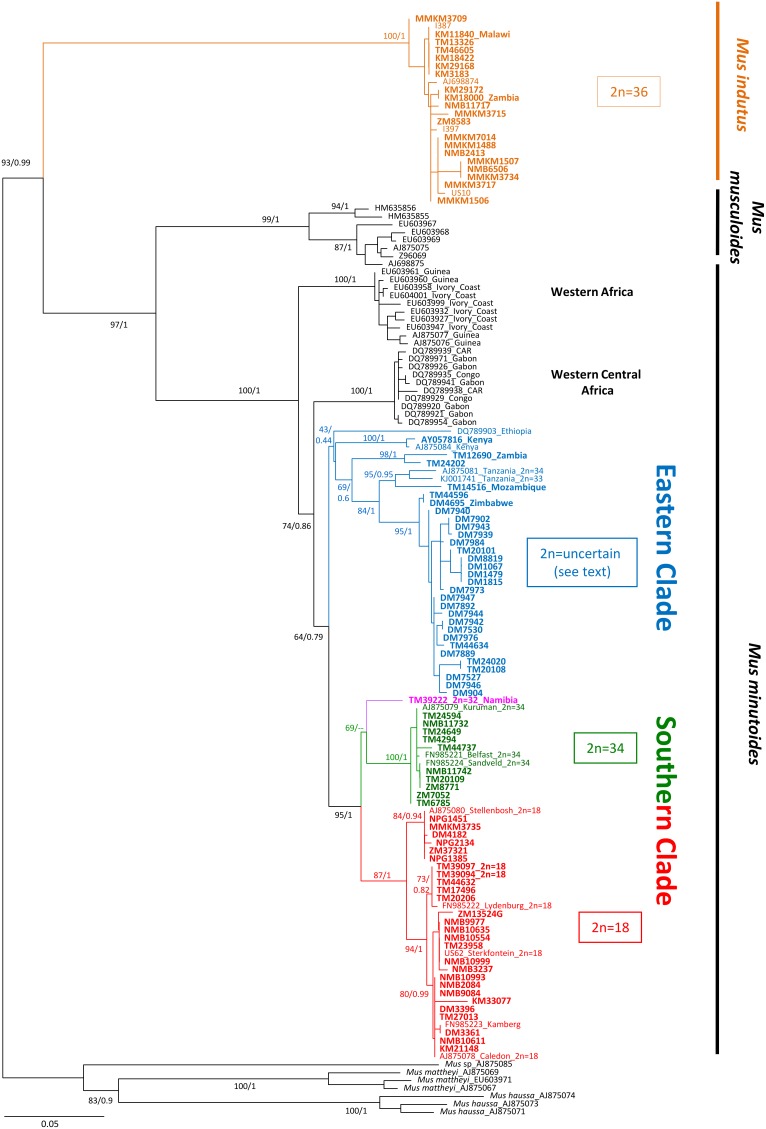
Figure 3. Maximum likelihood tree using cytochrome b sequences of the studied samples and those available through GenBank for other specimens and species.
Each specimen is designated by its accession or museum number, and country of origin outside of South Africa. Diploid numbers refer to museum or published data. Bootstrap support and the posterior probability values are indicated for the main nodes. The symbol “–” Indicates nodes that were not supported. Colours refer to the different species or cytotypes identified in our study; the museum samples are in bold.

