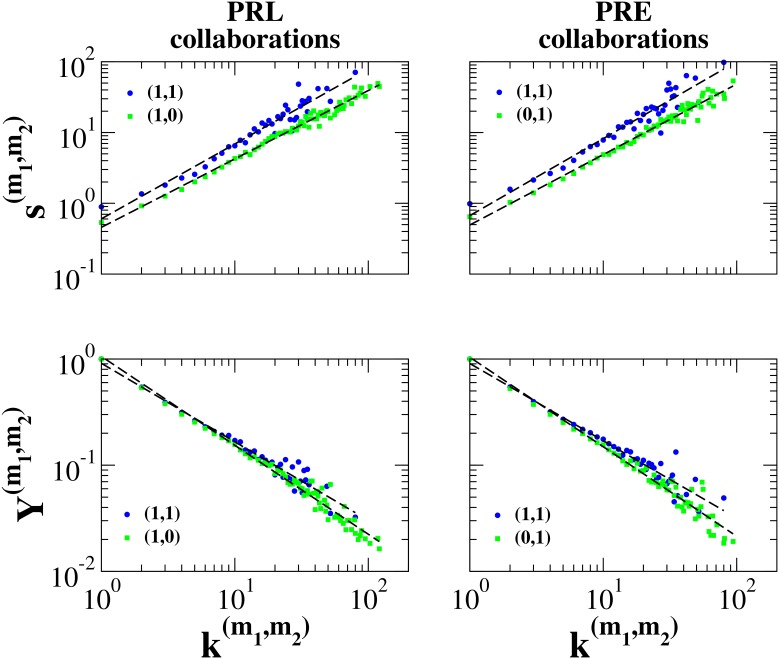
Figure 2. Average multistrength and average inverse multiparticipation ratio versus multidegree in the CoCo-PRE/PRL multiplex network.
The average multistrengths and the average inverse multiparticipation ratios are fitted by a power-law distribution of the type described in Eq. (8) (fitted distributions are here indicated by black dashed lines). Statistical tests for the collaboration network of PRL suggest that the exponents  defined in Eq. (8) are the same, while exponents
  are significantly different. Similar results can be obtained for the exponents in the PRE collaboration layer. Nevertheless, multistrengths
  are always larger than multistrengths
  and
and  , when multistrengths are calculated over the same number of multilinks, i.e.,
  (see Text S1 for the statistical test on this hypothesis).

