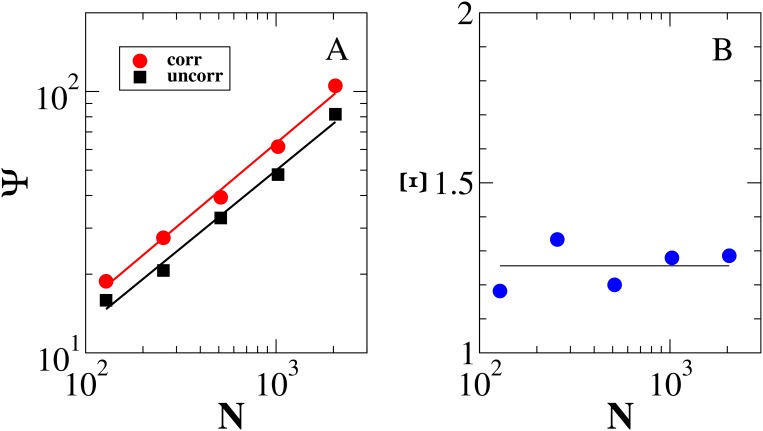
Figure 4. (A) Value of the indicator  defined in Eq.
(10) indicating the amount of information carried by the correlated and the uncorrelated multiplex ensembles of  nodes with respect to a null model in which the weights are distributed uniformly over the multiplex network. (B) Value of the indicator
  defined in Eq. (12) indicating the additional amount of information encoded in the properties of multilinks in the correlated multiplex ensemble with respect to the corresponding uncorrelated multiplex ensemble. The solid line refers to the average value of
  over the different multiplex network sizes.

