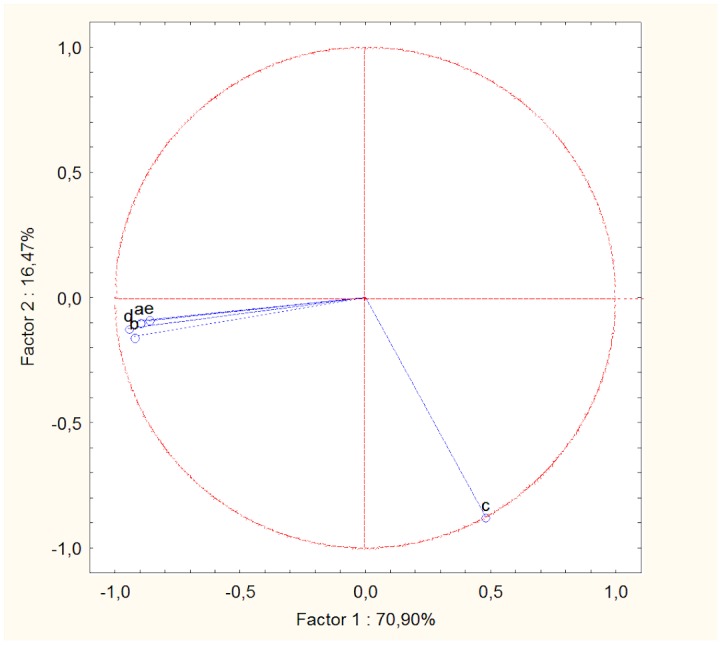
Figure 1. Results of the principal components analysis (PCA) for resident males.

The circle shows the correlation between the original variables and the two new components. a = male standardized dominance rank, b = male leadership score, c = rate of aggression displayed by males towards females, d = rate of the net number of approaches within 1 metre that males received by females, e = rate of affiliative behaviour displayed by males towards females. Pearson correlations between factor 1 of the PCA and the original variables were: −0.90 (a), −0.92 (b), 0.48 (c), −0.95 (d), −0.87 (e); Pearson correlations between factor 2 and the original variables were: −0.09 (a), −0.15 (b), −0.88 (c), −0.12 (d), −0.09 (e).
