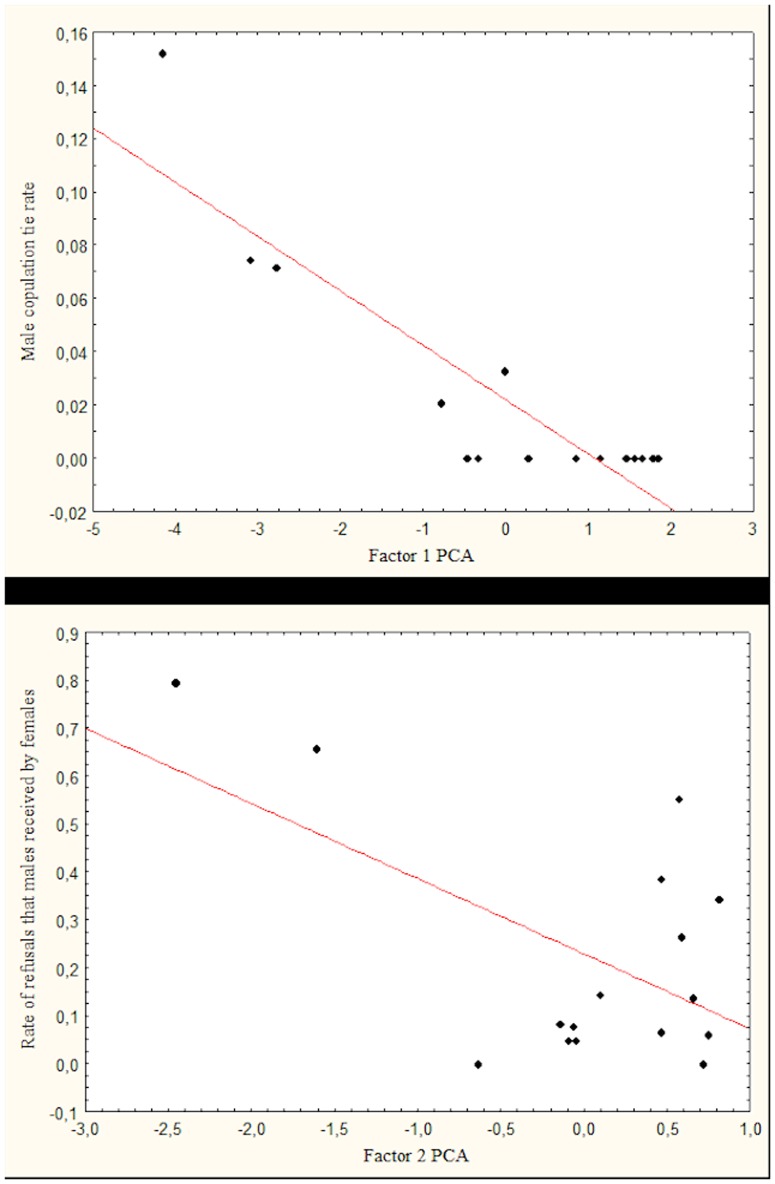
Figure 2. Results of the general linear models developed for males.
(a) The relation between ‘male copulation tie rate’ and the first factor of the PCA. High negative values on factor 1 indicate high-ranking males who often led the pack, who were frequently approached within 1 metre by females and who displayed both a high rate of affiliative behaviour and a low rate of aggressive behaviour towards females; (b) The relation between “rate of refusals that males received by females” and the second factor of the PCA. High negative values on factor 2 indicate a high rate of aggressive behaviour displayed by males towards females.

