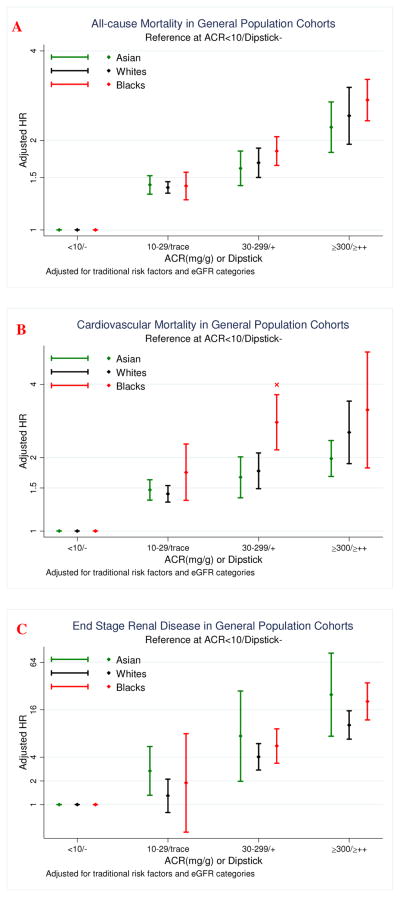
Figure 2.
Association of albuminuria with all-cause mortality (A), cardiovascular mortality (B), and ESRD (C) across three racial groups in general population cohorts. The whiskers represent 95% CIs. The reference category is ACR <10 mg/g or dipstick negative. Dots represent statistically significant points. Difference in hazard ratios (HR) among racial groups were tested using meta-regression with whites as a reference. HRs were adjusted for age, sex, smoking, systolic blood pressure, history of cardiovascular disease, diabetes, serum total cholesterol concentration, body mass index, and eGFR categories.

