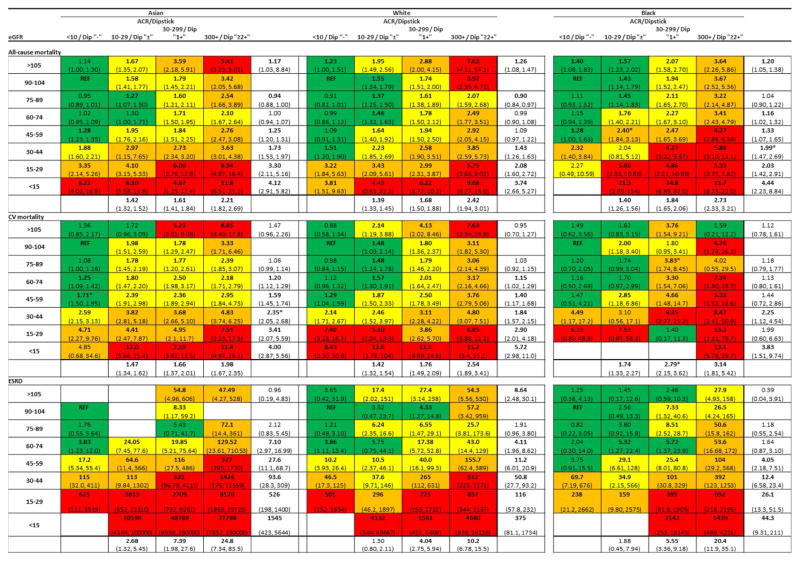
Figure 3.
Hazard ratios (HRs) of clinical outcomes according to eGFR and albuminuria categories across three racial groups in general population cohorts. Each number represents a pooled HR from meta-analysis adjusted for covariates and compared with the reference cell (REF) within each race. Bold numbers indicate statistical significance at P<0.05. Color shading indicates the strength of association (approximately one quarter of all cells across racial groups are shaded in each color; Green: low; yellow: mild; orange: moderate; red: high). Difference in HR among racial groups were tested using meta-regression with whites as a reference, and stars (*) indicate a significant interaction at P<0.05.

