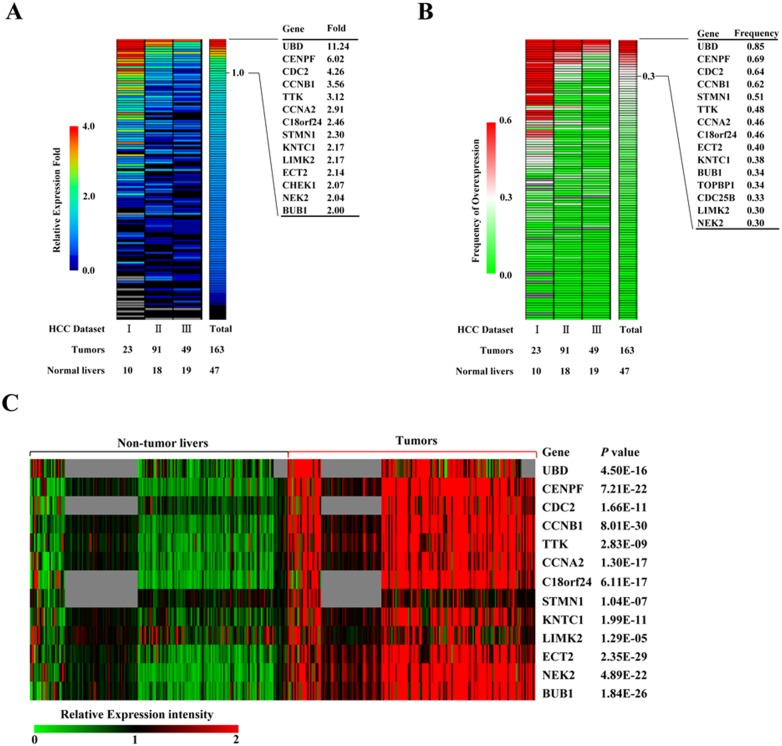
Figure 1. Expression profiles of selected mitotic spindle checkpoint genes in HCC microarray datasets.
Heat maps of relative fold change (A) and frequency of overexpression (B) of gene expression (rows) in three HCC microarray datasets (columns). Number of normal liver and HCC tumor samples per data set are shown below. (C) As the heat map shown, 13 mitotic spindle checkpoint genes differentially expressed between HCC and adjacent non-tumorous livers in 4 independent HCC microarray datasets. Missing data are denoted in gray. Transcriptional signal intensity is normalized in these datasets analyzed. The significance of differential expression between HCC and adjacent non-tumorous liver tissue was evaluated using a two-tailed t test, and P values are provided.

