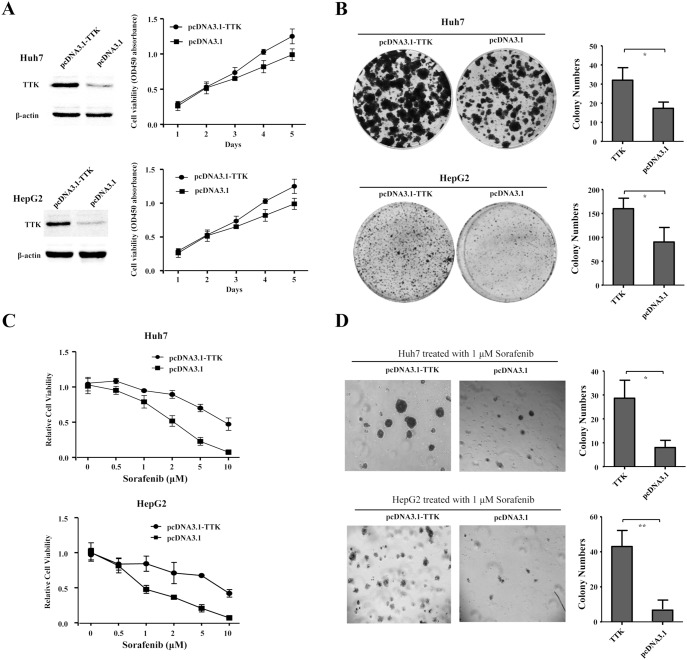
Figure 4. TTK overexpression promotes cell proliferation and resistance to sorafenib in HCC cells.
(A) Cell growth curves were described according to cell viability for five days (right panel), when recombinant pcDNA3.1-TTK and empty vector were transiently transfected into Huh7 and HepG2 cells respectively, confirmed by western blotting assay, where β-actin was used as an internal reference (left panel). (B) Representative dishes of anchor-dependent colony formation of Huh7 and HepG2 cells were shown, where these cells were transfected with recombinant pcDNA3.1-TTK and empty vector (left panel). The numbers of colonies were counted and statistically analyzed using a two-tailed t test (right panel). (C) The cytotoxic effects of sorafenib at different concentrations (0.5, 1, 2, 5, 10 µM) on cell viability was shown, where pcDNA3.1-TTK and empty vector were transfected into Huh7 (upper panel) and HepG2 (lower panel) cells, respectively. (D) As shown were the microscopic fields of anchorage-independent colony formation assay of Huh7 and HepG2 cells treated with 1 µM sorafenib, upon TTK overexpression (left panel). The numbers of colonies were counted and statistically analyzed using a two-tailed t test (right panel). *, P<0.05; **, P<0.01.

