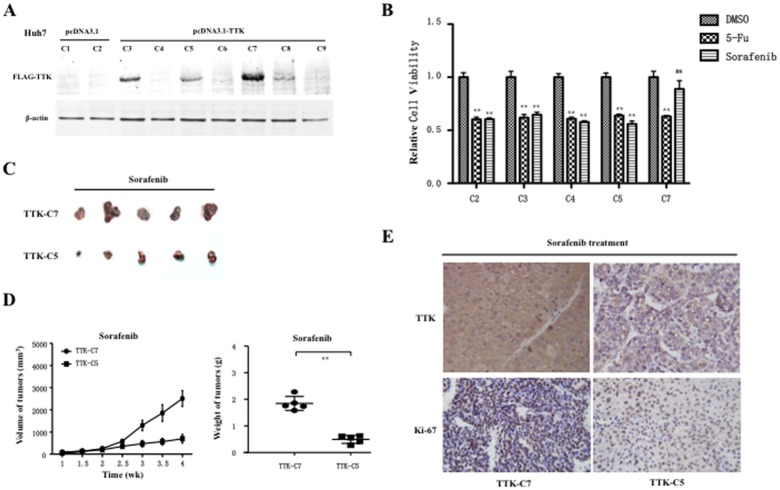
Figure 5. Tumorigenicity assay in nude mice of HCC cell subcolonies with TTK overexpression upon sorefanib administration.
(A) Western blot analysis showed expression profile of exogenous FLAG-tagged TTK in those Huh7 cell subcolonies. (B) The relative cell viability or cytotoxicity assays of those offspring subcolonies of Huh7 cells with different TTK expression levels were performed, upon vehicle control DMSO, sorafenib or 5-Fluorouracil (5-FU) treatment, where the relative cell viability to DMSO control is shown in the histograms and statistically analyzed using a two-tailed t-test. *, P<0.05; **, P<0.01. (C) 2×10⁶ offspring cells of C7 subcolony were subcutaneously inoculated into the flanks of nude mice, whereas the same amount of cells of C5 subcolony were inoculated into the opposite flank of the same mice (n = 5). These xenograft tumors were removed from the mice and photographed. (D) Tumor size was estimated by serial calibration, where mean tumor volume (± sd) (left panel) and tumor weights were statistically analyzed using two-tailed t-test. **, P<0.01 (right panel). (E) Representative pictures showed that immunohistochemistry staining assays of TTK and Ki-67 on xenograft tumours removed from the sorafenib-treated mice. All sections were counterstained with haematoxylin.

