
Figure 1.
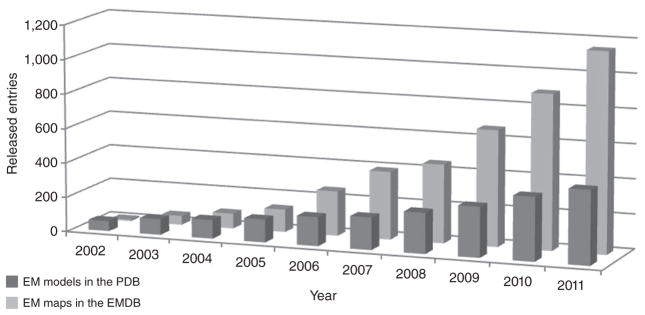
Trends in 3DEM. The cumulative number of released maps in the EMDB and 3DEM-derived models in the PDB are shown as a function of time.
Official websites use .gov
A
.gov website belongs to an official
government organization in the United States.
Secure .gov websites use HTTPS
A lock (
) or https:// means you've safely
connected to the .gov website. Share sensitive
information only on official, secure websites.
Trends in 3DEM. The cumulative number of released maps in the EMDB and 3DEM-derived models in the PDB are shown as a function of time.