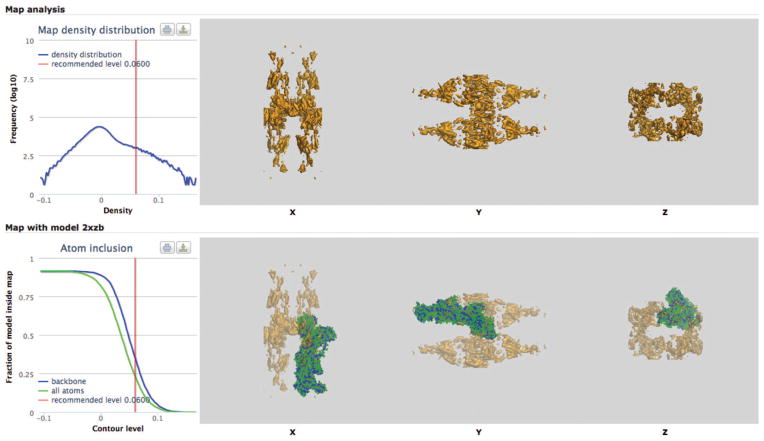
Figure 3.
Visual analysis of EMDB entries. Visual analysis page for EMDB entry EMD-1831 (http://pdbe.org/emd-1831/analysis), the structure of pig gastric H+,K+-ATPase with bound BeF and SCH28080 (ref. 24). The top right panel presents orthogonal surface projections of the map. The bottom right panel displays orthogonal surface projections of the map overlaid with the fitted PDB model 2XZB (green, all atoms; blue, backbone only). The chart on the top left shows the histogram of density values, and the one below shows the fraction of model atoms contained in the map as a function of contour level (red line, recommended level).

