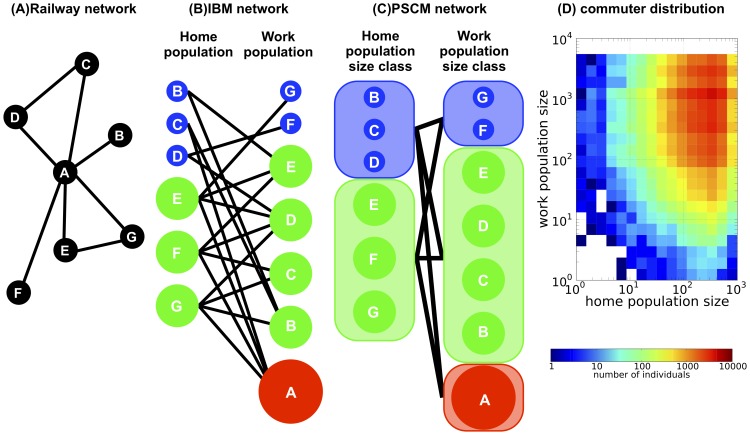
Figure 2. Schematic representation of the population size class model (PSCM).
(A) Geographical distribution of the railway network; each node corresponds to a station and each line corresponds to a commuter railway of commuter trains. Every station has a home population (those who reside in the area) and a work population (those who travel to as a workplace/school in the area). There are multiple commuters using the commuter train between each pair of populations. (B) The commuter network utilized in the individual-based model (IBM) calculations. The nodes correspond to the home and work populations of each station, forming a bipartite network in which each line denotes a connection via commuter flow between home and work populations. Local populations with different population sizes are represented by different colors and sizes. (C) The commuter network utilized in the PSCM calculation. Local populations with similar population sizes are grouped into population size classes, which form the nodes, while the total commuter flows between pairs of population size classes form the lines. (D) Joint distribution of the home and work population sizes of commuters in the Tokyo metropolitan area. The number  of commuters that live in a home population of size class
  and commute to a work population of size class
  is plotted as a density plot. The data were obtained from the Urban Transportation Census (UTC) commute data (Ministry of Land, Infrastructure, Transport and Tourism, The 10th Urban Transportation Census Report, 2007; in Japanese).

