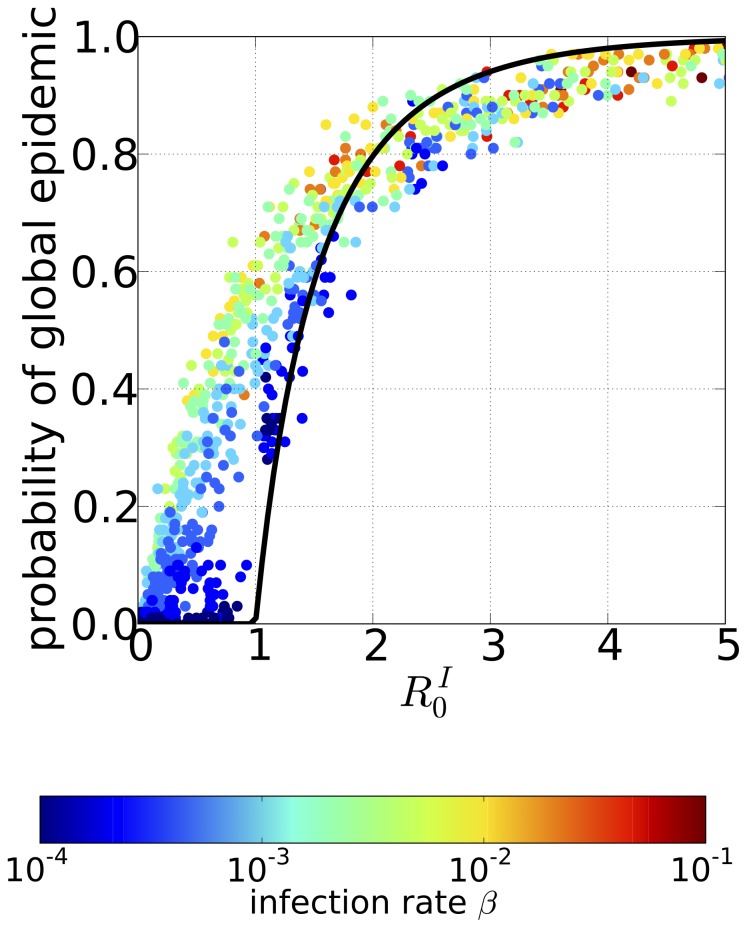
Figure 4. The probability of global epidemic as a function of the basic reproductive ratios in the initially infected home and work populations.
The probability of a global epidemic observed in the individual-based model (IBM) simulations based on the commute network data for the Tokyo metropolitan area plotted as a function of  , where the independent variable is the sum of the single population basic reproduction ratios of the initial home and work populations (
 and
and  : home and work population sizes of the initially infected individual, respectively). Each point corresponds to a different set of epidemic parameters, and the color represents the infection rate
  . Black line, the probability of a global epidemic in the single population model with population size
  , i.e., that from
  (main text for details).

