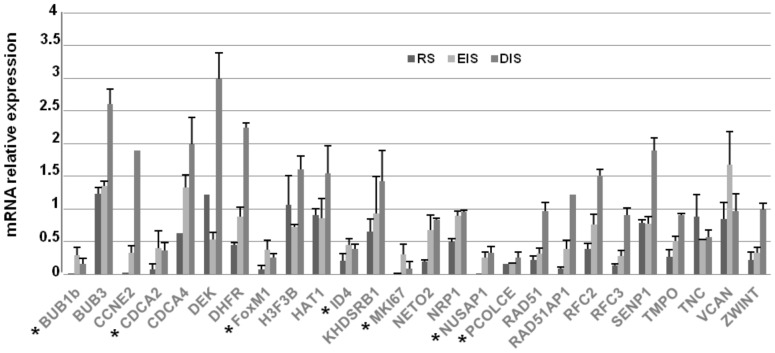
Figure 2. Expression profile of putative targets upon the induction of replicative or stress-induced senescence.
The expression levels of the 26 candidates were measured by Real Time PCR in replicative (RS: IMR90 cells at PDL 58), etoposide- (EIS: PDL 33 IMR90 cells treated with 20 µM etoposide for 24 h and then subcultivated for additional 10 days) and DEM-induced (DIS: PDL 33 IMR90 cells treated with 150 µM DEM on alternate days for 10 days) senescent cells. The mRNA relative expression was calculated by assigning the arbitrary value 1 to the amount found in young or DMSO-treated cells. SD is used to refer to the values obtained in 2 different experiments. Results showed that 7 mRNAs, highlighted by a star, resulted significantly (p<0.05) down-regulated, with a cut-off≥2 folds, in all conditions.

