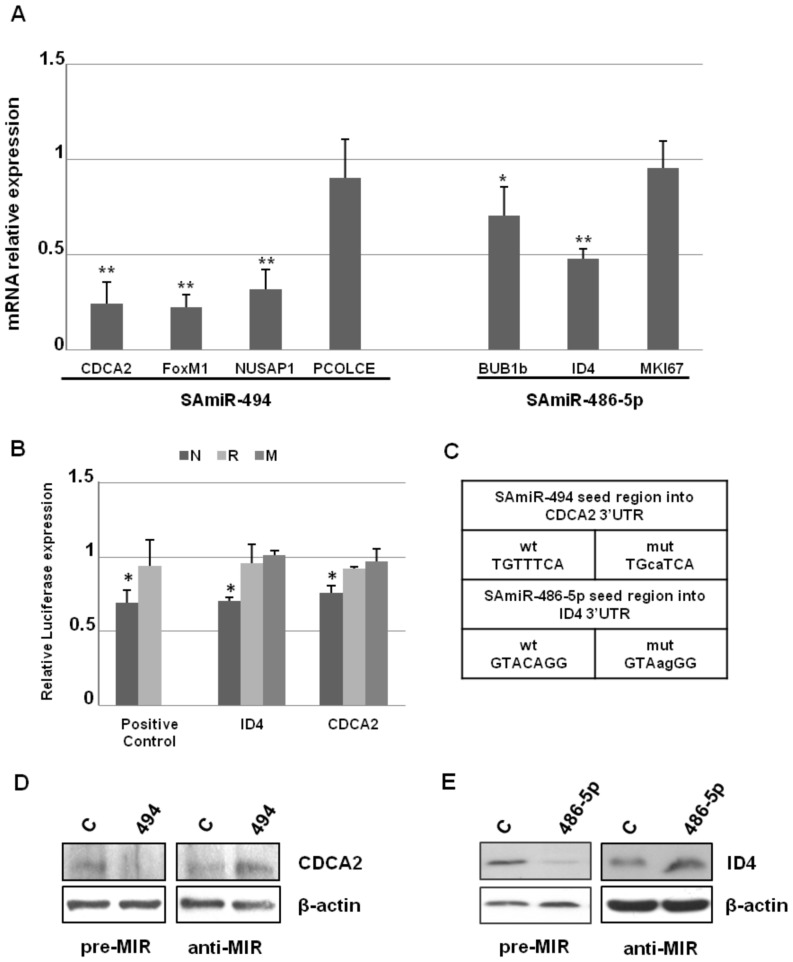
Figure 3. Expression profile of putative targets upon SAmiRs ectopic expression and validation of CDCA2 and ID4.
A) Expression levels of SAmiR-494 and SAmiR-486-5p putative targets 2 days after the transfection of the cognate SAmiR pre-miR in PDL 33 IMR90 cells. mRNA levels were measured by Real Time PCR and mRNA relative expression was calculated by assigning the arbitrary value 1 to the amount found in control cells transfected with a scramble pre-miR. SD refers to the values obtained in 3 different experiments and the difference was significant (** p<0.01; * p<0.05). The quantification of the expression levels of SAmiRs after their ectopic over-expression is reported in Panel A of Figure S2. B) Luciferase constructs bearing the normal 3’UTRs (N), reverse 3’UTRs (R) or mutated 3’UTRs (M) of CDCA2 and ID4 were transfected in HEK293 cells together with the cognate pre-miR or control pre-miR. The normal and reverse 3’UTR of OLFM4 were used as positive control. Luciferase levels were reported as fold changes compared to the values measured in control pre-miR transfected cells, after normalization with Renilla luciferase activity. SD refers to the values obtained in 3 different experiments (* p<0.01). C) Wild type seed regions of SAmiR-494 and SAmiR-486-5p, respectively present into the 3’UTRs of CDCA2 and ID4, compared to the mutated seed regions used for luciferase assays. D) Western blot analysis of CDCA2 in IMR90 cells over-expressing SAmiR-494 (pre-miR) or a specific SAmiR-494 inhibitor (anti-miR). E) Western blot analysis of ID4 in IMR90 cells over-expressing SAmiR-486-5p (pre-miR) or a specific SAmiR-486-5p inhibitor (anti-miR). In both cases, the proteins resulted suppressed by the SAmiR over-expression, as well as they resulted up-regulated by the anti-miR transfection, if compared to the control scramble transfected cells. The quantification of the expression levels of SAmiRs after their ectopic over-expression in D and E is reported in Panel B of Figure S2.

