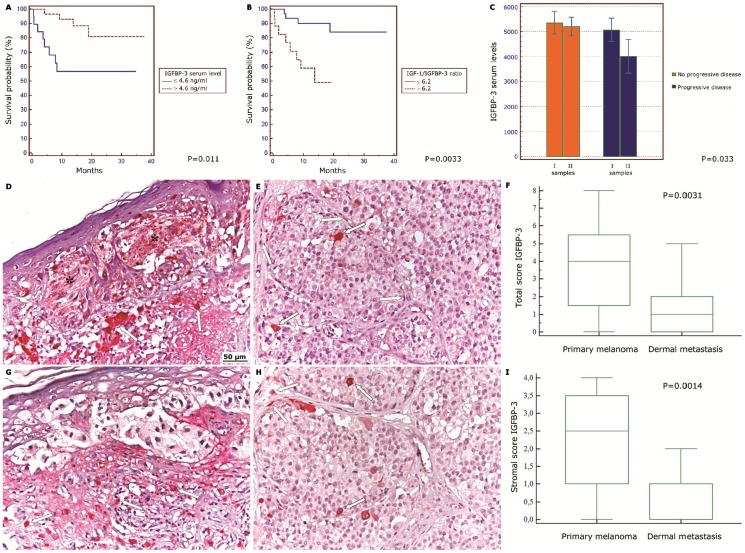
Figure 1. Low IGFBP-3 levels correlate with melanoma progression and patients' survival.
(A) Kaplan-Meier survival curve of melanoma patients having seric IGFPB-3 concentration higher (red line) or lower (blue line) than 4.6 ng/mL. Cut-off value was chosen by ROC curve. P value was calculated by log rank test. (B) Kaplan-Meier survival curve of patients with IGF-1/IGFBP-3 ratio higher (red line) or lower (blue line) than 6.2. Cut-off value was chosen by ROC curve. P value was calculated by log rank test. (C) Mean IGFBP-3 serum levels measured twice (28 patients) during the follow-up. Orange boxes: Patients with stable disease. Blue boxes: patients with progressive disease. P value was calculated by ANOVA test. (D,G) IGFBP-3 immuno-staining in tissue samples from primary melanomas. (E, H) IGFBP-3 immuno-staining in tissue samples from metastatic melanomas. The asterisks indicate positive melanocytes nests in primary melanoma. The arrows indicate IGFBP-3 positive stromal cells. Original magnification, X100. (F,I) Graphic data processing for total (upper panel) and stromal (lower panel) IGFBP-3 immuno-staining score. 20 different samples were taken in each case and the number of IGFBP-3 positive cells was separately counted by two researchers. For each slide, at least 7–10 microscopic fields were randomly chosen. The immuno-histochemical score was evaluated as described in the Methods separately for melanocytic and stromal cells and expressed as tumour and stromal score respectively. A total score was derived for each sample as the sum of tumour and stromal score. Central boxes correspond to values from lower to upper quartile (25th–75th percentile). Middle lines show median. Vertical lines extend from minimum to maximum value. P value calculated by Mann-Whitney U test.

