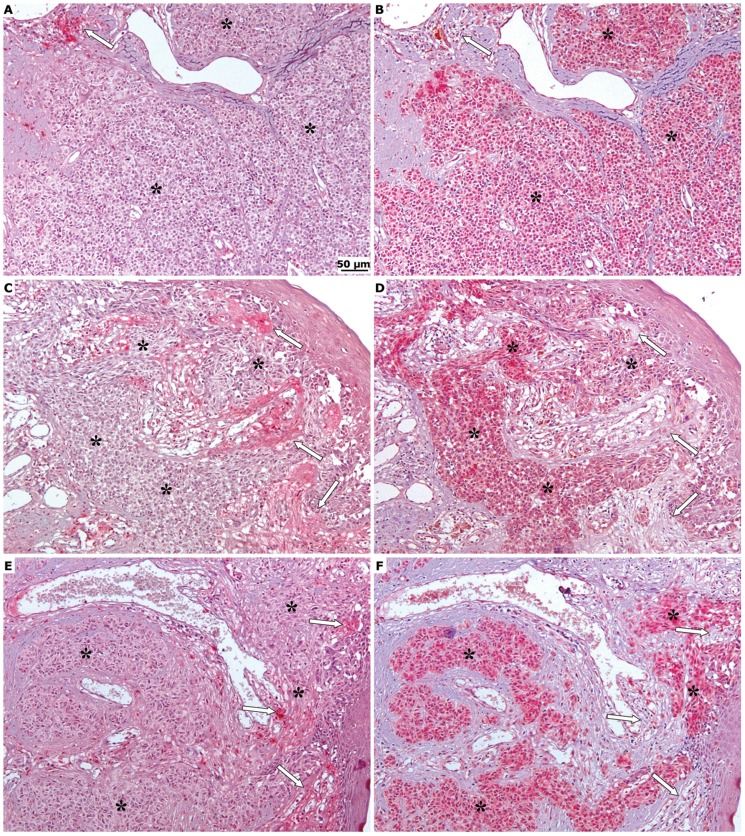
Figure 3. Inverse correlation between immuno-histochemical expression of IGFBP-3 and MMP-9.
Comparison of the immunohistochemistry for IGFBP-3 (A, C, E) and MMP-9 (B, D, F) in sequential sections obtained from primary melanomas and dermal metastases. The asterisks mark the melanocytes nests while the arrows indicate the stromal tissue. Original magnification X100. The IGFBP-3 and MMP-9 reactive cells were counted, and the scores determined, as described in Fig. 1 and in the Methods section.

