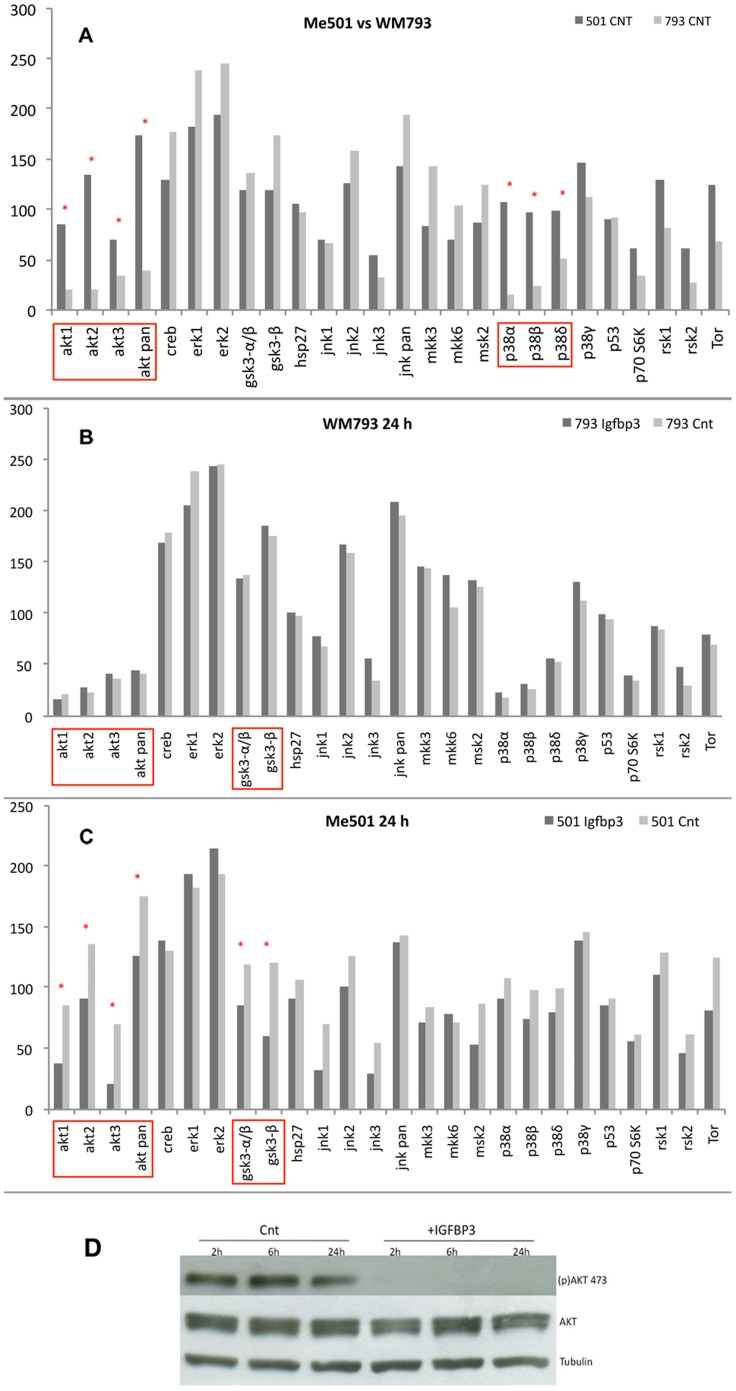
Figure 7. Analysis by phosphor-proteomic arrays of signal-transduction pathways involving in mediating IGFBP-3 action.
(A) Phosphorylation state of the indicated markers in primary (WM 793, light grey) and metastatic (Me501, dark grey) human melanoma cells, untreated. (B) WM 793 cells before (light grey) and after (dark grey) treatment with IGFBP-3 (C) Me501 cells before (light grey) and after (dark grey) treatment with IGFBP-3. The assays were performed and quantified as described in the Methods. All determinations were repeated at least three times (D) Western blot analysis of the phosphorylation state of Akt (Ser 473) in Me501 cells untreated or treated with IGFBP-3 for the indicated times. pAKT 473 = phosphor-(Ser473); AKT = total AKT: Tub = tubulin. The gel shown is representative of experiments that were repeated at least three times.

