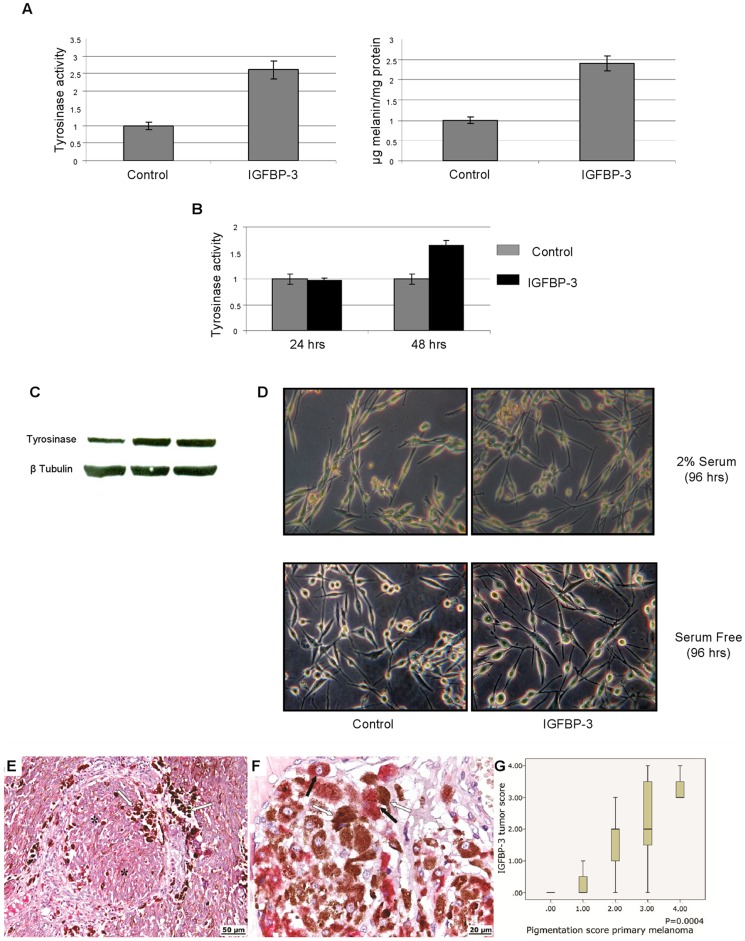
Figure 8. IGFBP-3 up-regulates tyrosinase activity and increases melanin content in Me501 cells.
(A) Tyrosinase activity measured by L-DOPA oxidation (left panel) and melanin content determined by measuring the absorbance at 405 nm (right panel) of lysates of Me501 cells grown in 2% serum, untreated or treated for 96 h with IGFBP-3 (2 µg/mL). (B) Tyrosinase activity of lysates of Me501 cell grown in the absence of serum for 24 and 48 h, treated and untreated with IGFBP-3 (C) Western blot analysis of tyrosinase content in Me501 cells after 0, 24 and 48 h of treatment with IGFBP-3 (2 µg/mL). (D) Phase-contrast microscopy of untreated and IGFBP-3-treated (2 µg/mL) Me501 cells, grown in the presence and in the absence of serum. Original magnification X100. (E, F) IGFBP-3 immuno-histochemical positivity in primary melanoma correlates positively with melanin content. IGFBP-3 is stained red, while melanin stains as dark-brown spots (E) X200 magnification (F) X400 magnification. The asterisks mark the IGFBP-3 immuno-positive melanocyte nests, the white and black arrows indicate the clusters of melanin and IGFBP–3 positive melanocytes, respectively. (G) Box plots showing the correlation between IGFBP-3 tumor score (calculated as described in the Methods) and sample pigmentation. P value was calculated by Mann-Whitney U test.

