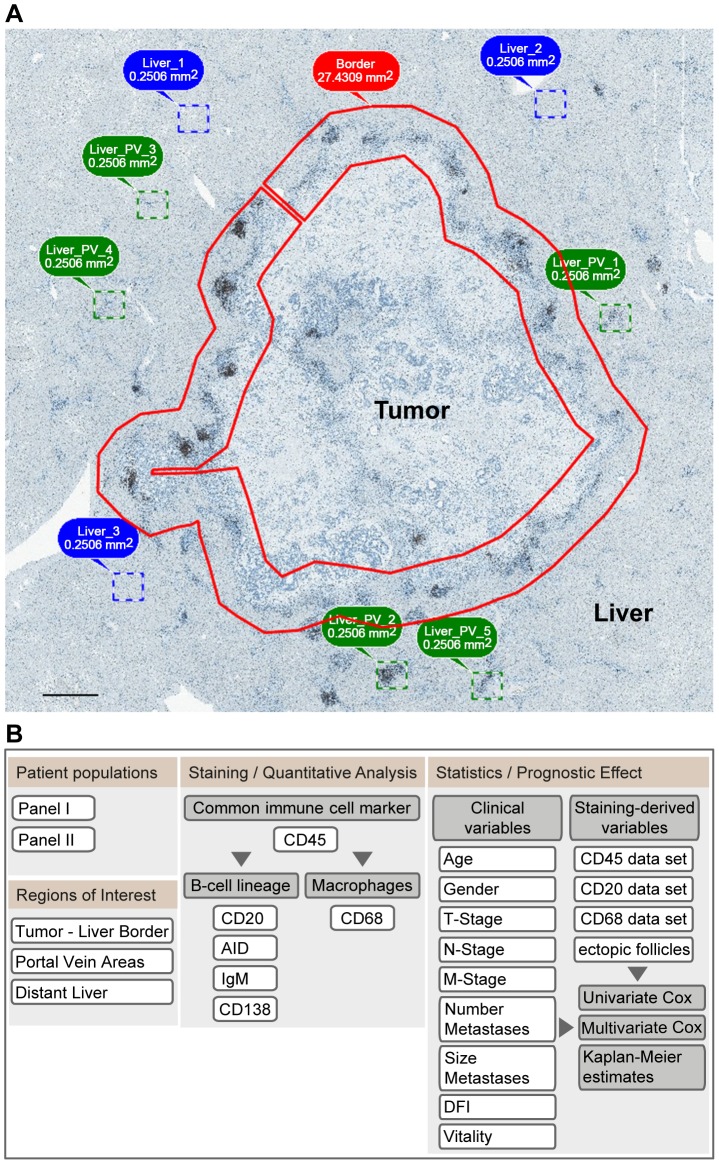
Figure 1. Algorithm for characterization, quantitative analysis, and estimation of the prognostic effect of immune cell populations.
(A) Definition of regions of interest within CRCLM tissue samples to unify the quantification strategy between the specimens. Upon acquisition of a large-scale sample using the microscopy-based TissueFAXS system, the regions of interest were defined at the tumor – liver border (indicated by a red line), within liver tissue around the portal vein areas (indicated by dashed squares in green) and areas within the liver tissues distant to the portal veins (indicated by dashed squares in blue). Of note, the herein defined strategy for using 0.5×0.5 mm area for analysis of the tumor – liver border was established empirically based on the microscopic evaluation of CD45-stained sections showing the lymphocyte accumulation within this region; this was specified independent to but matching the quantification area defined by Halama et al [3]. Scale bar: 1 mm. (B) Study design. The study design is summarized by the flowchart including staining with established markers, immune cell organisation pattern, quantification, and assessment of clinical relevance by alignment with clinicopathological parameters.

