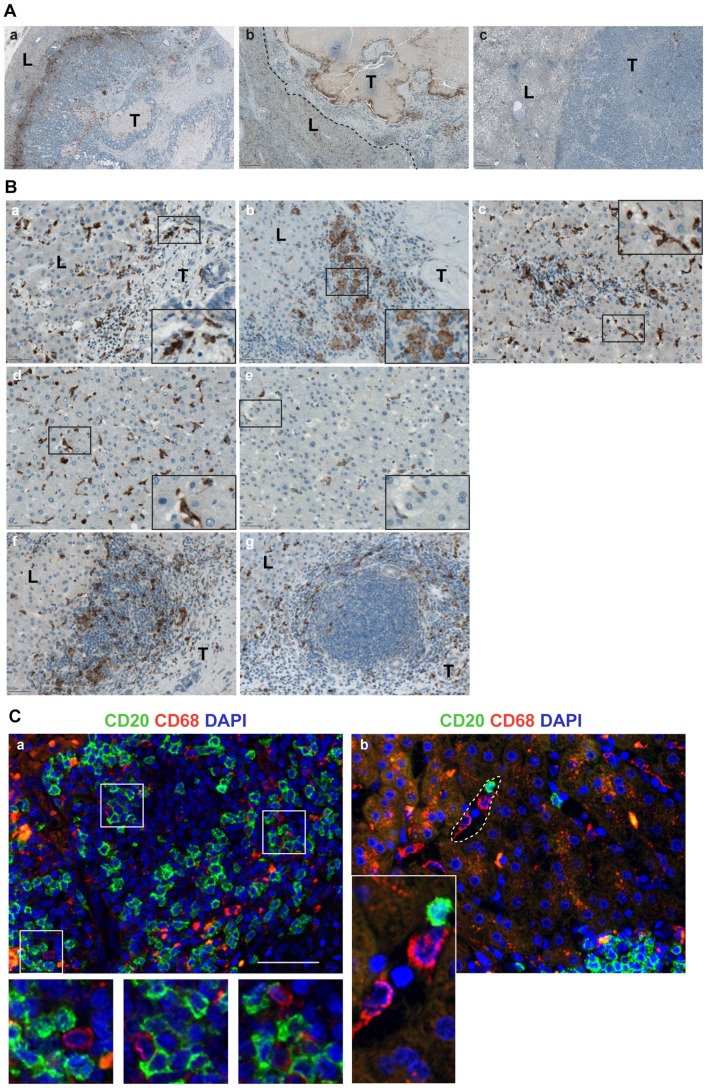
Figure 6. Localization patterns of CD68-positive macrophage populations across CRCLM specimens.
(A) Representative images of three major distribution patterns are shown: (a) accumulation of CD68-positive macrophages lining the tumor body within the tumor – liver border sub-region; (b) CD68-positive rim bounding tumor parts and differentiating them from necrotic areas within the metastatic body; tumor – liver margin is indicated by dashed line; (c) no preferential accumulation either at the border or tumor. Brown color, CD68 staining; blue color, nuclear counterstaining with haematoxylin. Scale bar 500 µm. T: tumor; L: liver. (B) Various subpopulations of CD68-positive lymphocytes (a, b) at the tumor – liver border and (c) within the portal vein area characterized by well-spread or round shaped morphology are shown; in addition, (d, e) resident CD68-positive Kupffer cells within distant liver shows inter-patient variability regarding intensity of staining and density; representative images of CD68-positive cells within (f) large immune cell aggregates and (g) ectopic follicles. Scale bar 50 µm. Inserts: the high-power views. T: tumor; L: liver. (C) Double immunofluorescent staining to visualize the co-localization of CD20-positive B cells and CD68-positive macrophages within the tumor – liver sub-region. The merged images are shown (green channel for CD20, red channel for CD68, and blue channel for DAPI): (a) direct cell-cell contact between CD20- and CD68-positive lymphocytes; (b) CD20-positive B cells might co-localize with the resident CD68-positive Kupffer cells within vascular sinusoids; example of such sinusoid is highlighted by a dashed line. Scale bar 50 µm. Inserts: the high-power views.

