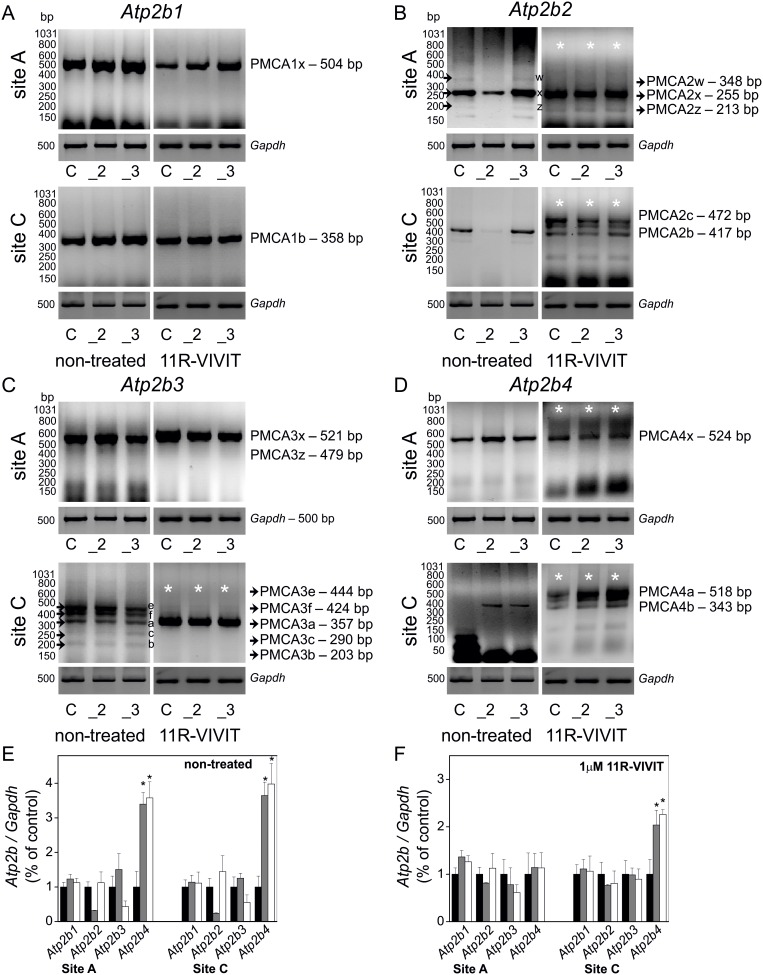
Figure 3. Alternative splicing of PMCA in PMCA2- or PMCA3-deficient PC12 cells upon NFAT inhibition.
Alternative splicing pattern at sites A and C of mRNA transcripts of PMCAs: Atp21b1 (PMCA1) (A), Atp21b2 (PMCA2) (B), Atp21b3 (PMCA3) (C), Atp21b4 (PMCA4) (D) was determined by RT-PCR in non-treated and 1 µM 11R-VIVIT-treated PC12 cells. RT-PCR product bands were quantified densitometrically, standardized to Gapdh and normalized to control cells, expressed as y = 1, both for non-treated (E) and 11R-VIVIT-treated cells (F). Student’s t-test was used for comparison of control cells with PMCA2- or PMCA3-reduced cells (n = 3). Bars represent mean values ± SEM. *P≤0.05. Symbols: control cells (C), PMCA2-deficient cells (_2), PMCA3-deficient cells (_3). Black arrows indicate the PCR product bands for PMCA2 site A and PMCA3 site C. White asterisks on the images of gels indicate the PCR product bands generated by alternative splicing that underwent a significant change upon NFAT inhibition with 11R-VIVIT.

