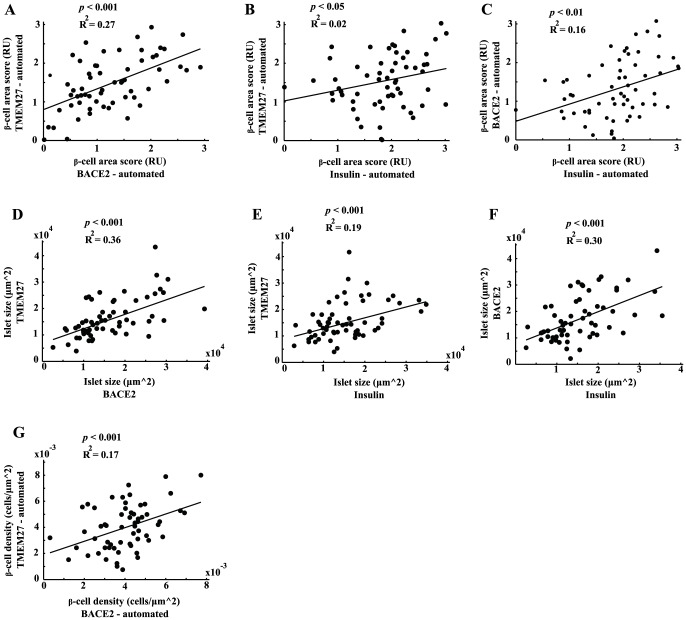
Figure 3. Extraction of islet specific features per individual patient.
Correlation of TMEM27 and BACE2 (A), TMEM27 and insulin (B), and BACE2 and insulin area scores per patient (C). Correlation of islet size assessed either by TMEM27, BACE2, and insulin per patient (D-F). Correlation of β-cell density assessed either by TMEM27 or BACE2 positive cells per patient (G). Values in Figure A-G were assessed by the automated pipeline and points represent the median values per parameter and patient.

