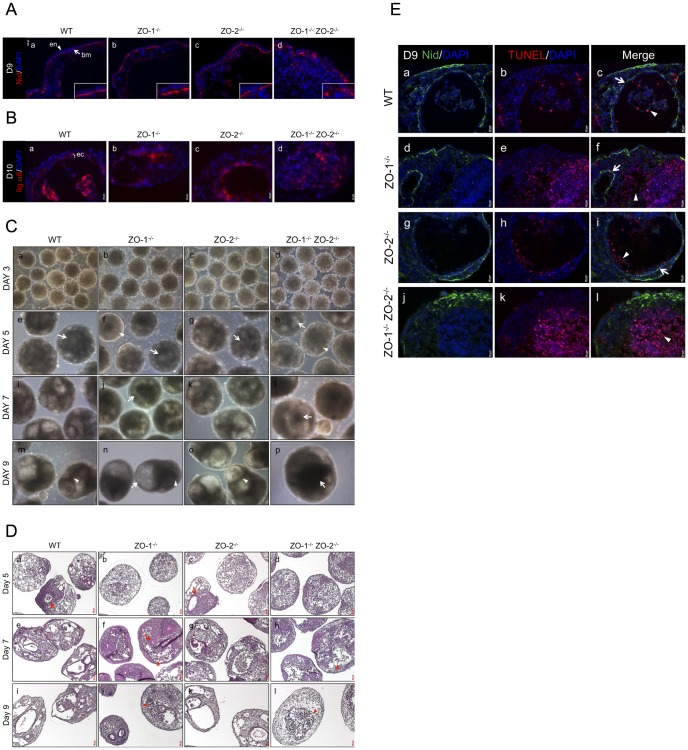
Figure 6. Depletion of ZO-1 and ZO-2 is associated with aberrant basement membrane deposition and irregular cavitation.
(A) Immunofluorescence staining of Nidogen. EB cryosections from Day-9 cultures (panels a–d) were immunostained for the BM component Nidogen (red color, arrow). ExEn and BM are indicated by arrowhead and arrow respectively. Nuclei are labeled with DAPI (blue color). Magnification of image in insets. (B) Immunofluorescence staining of PrEc. The immunodetection of Integrin α6 was used as a specific marker for PrEc visualization in Day-10 EB cultures (panels a–d, red color). Nuclei are labeled with DAPI (blue color). PrEc is indicated here as ‘ec’. (C) Phase-contrast microscopy. Cavity development in live EBs was tracked by phase-contrast imaging on Day-3 (panels a–d), Day-5 (panels e–h), Day-7 (panels i–l) and Day-9 (panels m–p) of culture. (D) H&E histological staining. PFA-fixed and paraffin-embedded EB sections were treated with H&E stains to visualize the gross structure of the EBs. EB histology was analyzed at Day-5 (panels a–d), Day-7 (panels e–h) and Day-9 (panels i–l). (E) TUNEL staining of apoptotic cells. Cryosections of EBs at Day-9 culture were immunostained with Nidogen (Nid) to demarcate the BM boundary of cavities (panels a,d,g,j, green color). TUNEL-positive apoptotic cells were visualized in red color (panels b,e,h,k). Merged images (panels c,f,i,l). Nuclei are labeled with DAPI (blue color).

