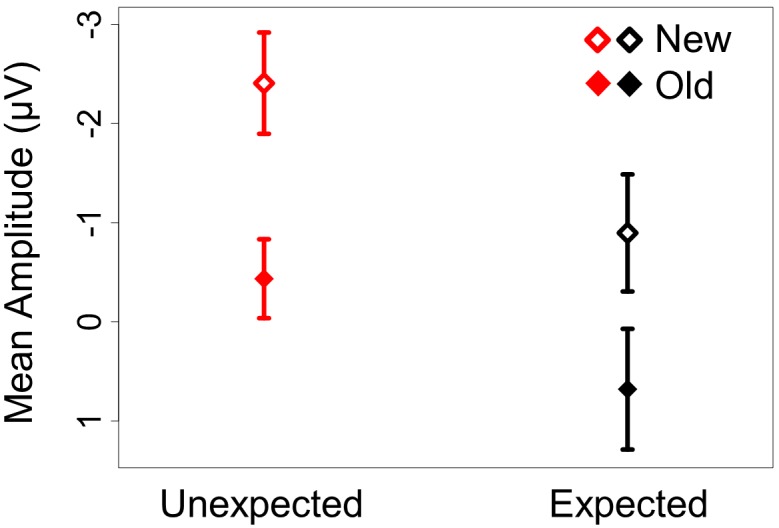
Figure 5. Interaction plot showing additive effects of repetition and predictability in mean amplitude during the N400 time window (300–400 ms) at the midline posterior region.

The expected and unexpected conditions are plotted in black and red respectively.
