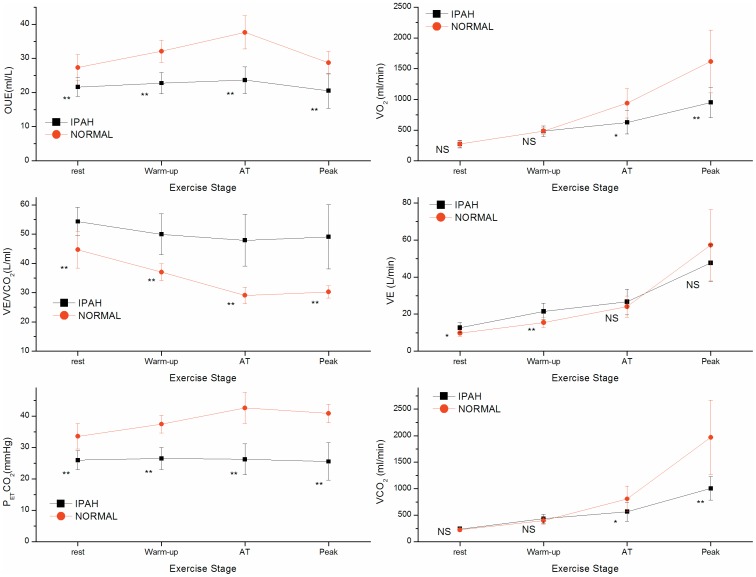
Figure 3. Difference of CPET parameters between IPAH and control groups at different stages of exercise.
The group mean±SD Values of IPAH) and control (NORMAL) groups are shown at stages of rest, unloaded cycling, AT, and peak exercise during incremental cycle ergometry tests. Values are. On the left side from top to bottom, they are OUE, V˙E/V˙CO2 and PETCO2.; on the right side from top to bottom they are V˙O2, V˙CO2 and V˙E. Statistically significant differences between groups at the same stage are shown as NS for no significance, * for P<0.05, ** for P<0.005, below value symbol.

