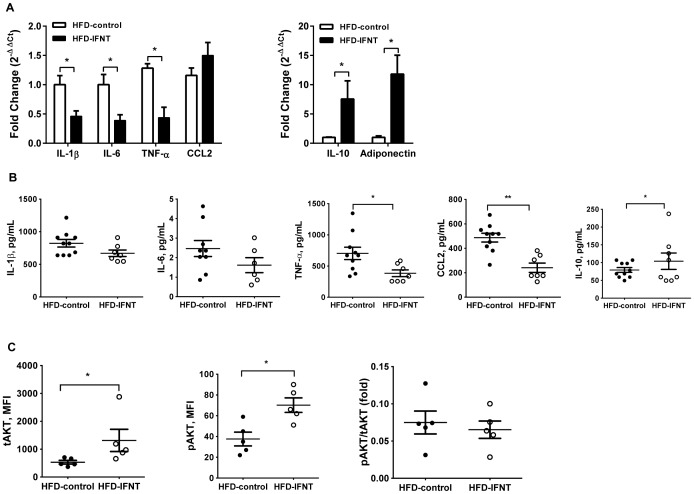
Figure 3. IFNT administration altered the cytokine profile and insulin signaling.
(A) Gene expression of cytokines. Cytokines, chemokine (C-C motif) ligand 2 (CCL2) and adipokineadiponectin in VAT of HFD mice measured using quantitative reverse transcriptase-PCR (qRT-PCR; normalized to β-actin). IL, interleukin; TNF-α, tumor necrosis factor-α. (B) Concentration of IL-1β, IL-6, TNF-α, CCL2, and IL-10 in plasma of HFD mice were measured using the Bio-Plex™Cytokine Assay (Bio-Rad). (C) Adipose tissue insulin signaling. After 16-h fasting, mature adipocytes were collected from VAT and treated with insulin (100 nM) for 15 min. Total AKT (tAKT) and phosphorylated AKT (pAKT) protein in adipocytes were measured using Bio-Plex Cell Signaling Magnetic Assays (Bio-Rad). Data are presented as mean ± SEM. *P<0.05.

