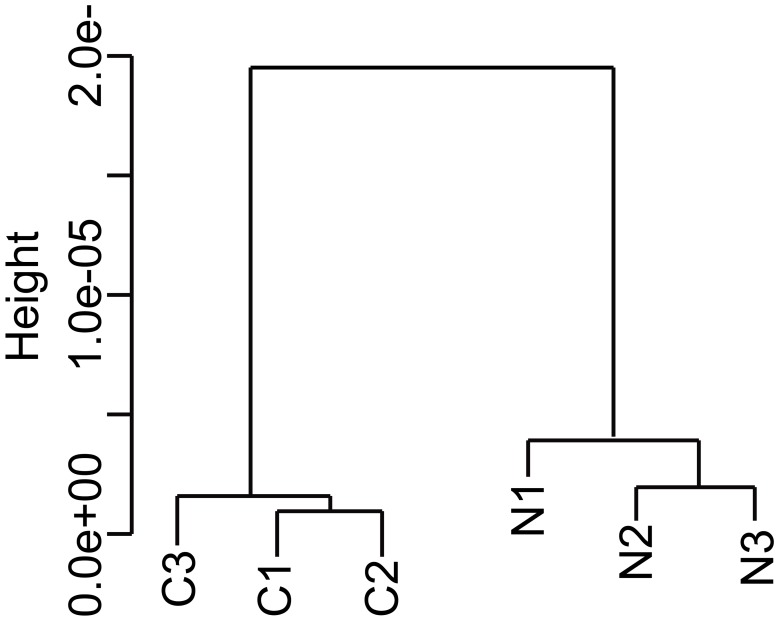
Figure 4. Cluster dendrogram.
A cluster dendrogram was generated using rice seed gene expression data from six samples and the “pvclust” function. Each sample was prepared at 15-DAF seeds from 24 control or 24 N-fertilized plants and were pooled. Three sets of five seeds were picked from each seed pool. C, control samples; N, N-fertilized samples.

