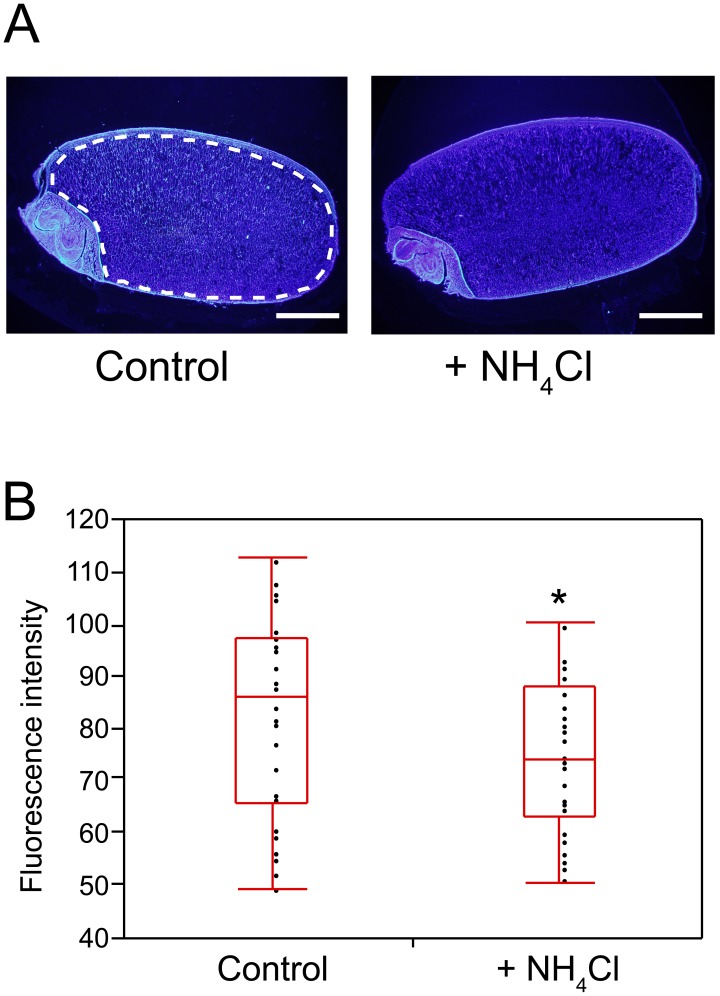
Figure 6. β-Glucan content of rice grains.
(A) Histochemical staining of mature rice seed. Cross-sections of grains from the control plot (left) and from the N-fertilized plot (+NH4Cl; right) are shown. Sections were stained for β-glucan using calcofluor white. The white-dotted line indicates the area analyzed for fluorescence intensity. The fluorescence intensity of the endosperm was calculated by adjusting the background intensity. Scale bars, 1 mm. (B) Endosperm fluorescence intensity was analyzed using ImageJ. Sections were cut from 30 randomly selected grains from each plot. The horizontal line inside the box plot indicates the median value. The inner box indicates the interquartile range and runs between 25th and 75th percentiles. The upper line extending from the box indicates the largest value between the 75th percentile and the point at 1.5 times the interquartile range. The lower line extending from the box indicates the smallest point between the 25th percentile and the point at 1.5 times the interquartile range; *P<0.05.

