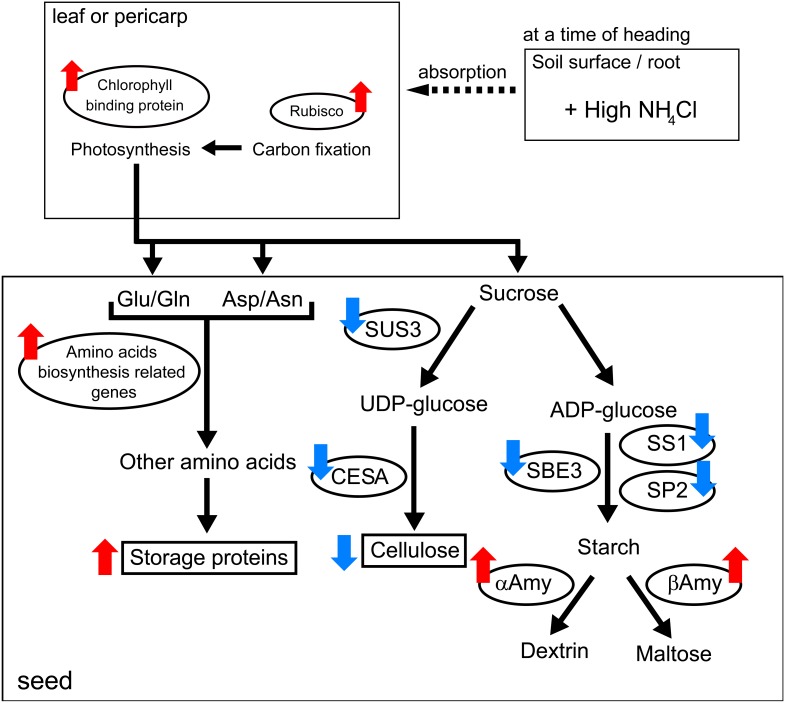
Figure 7. Changes in gene expression and rice seed compounds with additional fertilization.
Notable change in mRNA expression and seed compounds are summarized. Molecules in the open oval are DEGs from DNA microarray experiments. Rectangles show the compound whose content was measured in this study. Red and blue arrows indicate up- and down-regulation by additional nitrogen fertilization, respectively. SUS3, sucrose synthase 3; CESA, cellulose synthase A catalytic subunit; SBE3, starch-branching enzyme 3; SS1, starch synthase 1; SP2, starch phosphorylase 2; αAmy, α-amylase; βAmy, β-amylase.

